Download presentation
Presentation is loading. Please wait.

1
VIEWING SURVEY DATA IN CONTEXT: CRITICAL, MAINTENANCE AND DESIGN TRIGGER LEVELS Jonathan Clarke Canterbury City Council

2
Introduction 12 years+ of survey data at all beach management sites In early years difficult to reach conclusions, or make predictions with any degree of certainty Beach performance can now be predicted with a reasonable level of confidence Now possible to view survey results in context

4
Beach Management Plans Inconsistency in beach management plans, trigger levels and methods used to monitor them. Not comparable between areas Standard of protection varies Input conditions eg. Hydrodynamics different Historic BMPs often based on a limited dataset

5
Trigger Levels and Beach Design CREST HEIGHT CREST WIDTH DESIGN BEACH MINIMUM BEACH

6
Regional Shingle BMPs REGIONAL SHINGLE BMP Wave Buoy Data Met Office Hindcast Data (33y) Beach Survey Data Joint Probability Study Seawall Surveys Seawall Schematics Improved Wave Run-up Study EA Extreme Sea Levels Sediment Budget Study Bathymetric Survey Data LiDAR Data Beach Management logs
 Beach Survey Data Joint Probability Study Seawall Surveys Seawall Schematics Improved Wave Run-up Study EA Extreme Sea Levels Sediment Budget Study Bathymetric Survey Data LiDAR Data Beach Management logs")
7
Hydrodynamics Four sources of data; Met office Hindcast data (33 year data set) Measured data from 13 Directional Wave Rider Buoys (3-9 year data set) Measured data from WaveNet sites at Hastings and Poole bay (8 year data set) Extreme sea levels (Coastal Boundary Conditions) * Measured data used for validation and sensitivity analysis of the Met Office dataset
 Measured data from 13 Directional Wave Rider Buoys (3-9 year data set) Measured data from WaveNet sites at Hastings and Poole bay (8 year data set) Extreme sea levels (Coastal Boundary Conditions) * Measured data used for validation and sensitivity analysis of the Met Office dataset")
8
Hydrodynamics Met Office hindcast data: 52 Nearshore points

9
Hydrodynamics

10
Joint Probability Return Periods for extreme water levels were obtained from the EA water level boundary set Joint Probabilities were calculated using the HR Wallingford TR2 SR653 Desktop Calculator

11
Depth Limitation All management units have depth limited nearshore waves 1D energy decay numerical model used to calculate Breaker Index (Van der Meer, 1990) Max Hs between 50- 60% of water depth for study area
 Max Hs between % of water depth for study area")
12
Joint Probability

13
Sediment Budget (Rosati and Kraus, 1999) Q input = Volume of sediment entering the cell from updrift cell Q output = Volume of sediment leaving the cell to the downdrift cell Δ V = Volumetric change P =Material deposited on the frontage R = Material removed from the frontage L = Material lost through natural process Residual = The degree to which the sediment budget has been closed. In a closed system residual should near 0.

14
Balancing the Budget Δ V = 5,000m 3 /yr R = 1,000m 3 /yr P = 2,000m3/yr Q input = 5,000m 3 /yr Q output = ? Residual = 0 L = 200m 3 /yr When Residual = 0: Q output = -( Δ V – P + R - L) + Q input Q output = -(5,000 – 2,000 + 1,000 - 200) + 5,000 Q output = 800m 3 /yr
 + Q input Q output = -(5,000 – 2, , ) + 5,000 Q output = 800m 3 /yr.")
15
Sediment Budget

16
Overtopping

17
Initial calculations run with no beach (i.e. worst case) Vertical Wall (or relevant structure) used, the results of which are considered more reliable than calculations using beach configurations. RPMax OT 1:123.667 1:234.887 1:543.039 1:1043.267 1:2047.835 1:5058.427 1:10060.128 1:20085.014
 Vertical Wall (or relevant structure) used, the results of which are considered more reliable than calculations using beach configurations. RPMax OT 1: : : : : : : :")
18
Overtopping Check performed with other methodology to ensure no beach result is within 10% of Previous method. Results run for different beach levels, minimal to design, and for each set of RP conditions. CSA used not crest width/height etc.

19
Overtopping Methodology

20
Overtopping Validation

21
Seawall Impact Damage Asset inspections and research into structural integrity of defences not included in scope of report CSA level at which seawall gets exposed to be included. (For exposed walls any OT has impact)
.")
22
Seawall Undermining Common failure mechanism with several examples in the South East Due to scour, visible (and surveyed) beach levels may not reflect the risk Minimum CSA to prevent scour that may undermine defences to be provided
 beach levels may not reflect the risk Minimum CSA to prevent scour that may undermine defences to be provided")
23
Seawall Undermining SCOUR DEPTH

24
What is the purpose of the Beach? Engineering Prevent/reduce overtopping Protect the seawall Prevent undermining of the seawall Protect Cliffs Protect Property/Infrastructure Other Amenity Value Environmental Considerations Launching of vessels

25
What is the purpose of the Beach?

26
Flooding

27
Defence Sections

28
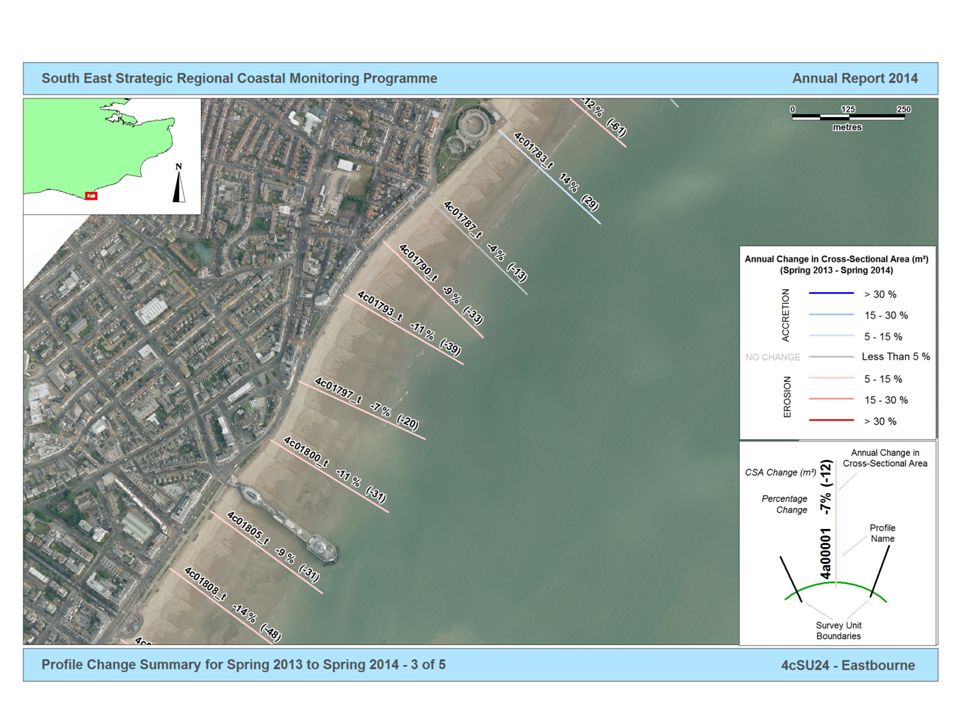
Example - Eastbourne Seawall Height: 6.2m Rear Wall: 9.5m

29
Standard of Protection Methodology CRITICAL LEVEL Define Maximum Allowable Overtopping (1:200 years) Proximity of Structures Transport Links Susceptibility to Flooding Risk of Erosion Behind Defence MAINTENANCE LEVEL Set using maximum observed drop in CSA annually or through large storm(s) DESIGN LEVEL Adjustment to account for; Larger Storms/Year with increased storm frequency Erosive Nature of Beach Impacts of excessive Overtopping
 Proximity of Structures Transport Links Susceptibility to Flooding Risk of Erosion Behind Defence MAINTENANCE LEVEL Set using maximum observed drop in CSA annually or through large storm(s) DESIGN LEVEL Adjustment to account for; Larger Storms/Year with increased storm frequency Erosive Nature of Beach Impacts of excessive Overtopping")
30
Standard of Protection Methodology CRITICAL MAINTENANCE DESIGN

31
Standard of Protection Methodology

32
Example - Eastbourne

33
Eastbourne – Sediment Transport

34
Eastbourne – Erosion/Accretion

35
Eastbourne – SoP Profile Map

36
Example - Eastbourne SECTION D – East of Pier

37
Example - Eastbourne RECYCLINGRECHARGE EROSION

38
Example - Eastbourne

39
SECTION B – Towards Beachy Head

40
Example - Eastbourne RECHARGE

41
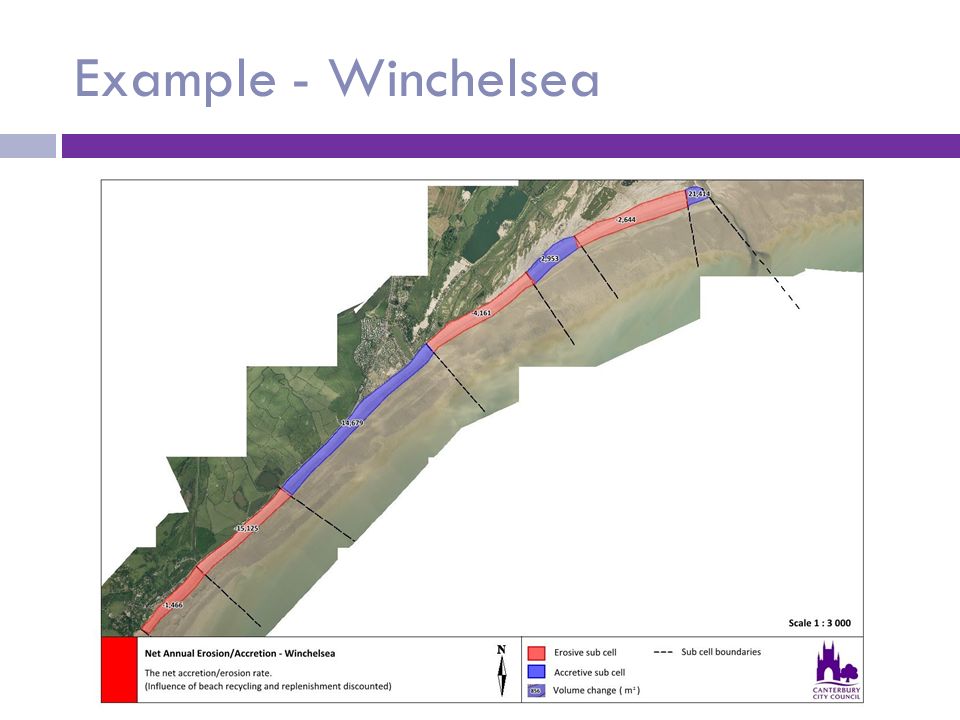
Example - Winchelsea

44
Winchelsea

45
Example - Winchelsea Western End

46
Example - Winchelsea RECYCLING

47
Future Impacts on Trigger Levels Deterioration of seawall condition Seawall raising or repair New development behind the sea defence Groyne failure Introduction of new or larger controlling structures Reduction of input sediment to the system A significant change to the grading characteristics of the beach material Drop in foreshore levels Climate change

48
Conclusion Trigger Levels put Monitoring Data in Context Provide consistency along the coastline Aid decision making process and beach management Potentially create efficiencies Future Regional BMPs North Kent (Graveney – Minnis Bay) South Downs (Brighton to Littlehampton) East Kent (Pegwell Bay – Oldstairs Bay)
 South Downs (Brighton to Littlehampton) East Kent (Pegwell Bay – Oldstairs Bay)")
Similar presentations


>")


 Sediment Transport Prediction Sand: ATV Surveys Sand: LIDAR Surveys Beach Safety (rips) Pathogen Transport (beach.>")


