Download presentation
Presentation is loading. Please wait.

1
Categorizing Data

2
Qualitative vs Quantitative Data Qualitative Deals with descriptions. Data can be observed but not measured. Colors, textures, smells, tastes, appearance, beauty, etc. Qualitative → Quality

3
Example: Qualitative blue/green color, gold frame smells old and musty texture shows brush strokes of oil paint peaceful scene of the country masterful brush strokes

4
Quantitative Deals with numbers. Data which can be measured. Length, height, area, volume, weight, speed, time, temperature, humidity, sound levels, cost, members, ages, etc. Quantitative → Quantity

5
Example: Quantitative picture is 10" by 14" with frame 14" by 18" weighs 8.5 pounds surface area of painting is 140 sq. in. cost $300

6
Univariate vs. bivariate Univariate Single variable No relationships or causes Used to: central tendency - mean, mode, median dispersion - range, variance, max, min, quartiles, standard deviation. frequency distributions bar graph, histogram, pie chart, line graph, box-and-whisker plot

7
Bivariate 2 variables Deals with causes or relationships Used to: analysis of two variables simultaneously correlations comparisons, relationships, causes, explanations tables where one variable is contingent on the values of the other variable. independent and dependent variables

8
Example: univariate How many of the students in the freshman class are female?

9
Example: bivariate Is there a relationship between the number of males in Computer Programming and their scores in Mathematics?

10
A fitness magazine printed a readers ’ survey. Statements 1, 2, and 3 are interpretations. Which do you think the magazine would use? The population is the entire group being studied. The sample is the part of the population being surveyed.

11
Sources of Biased Data Selection bias: In a statistical study, it is important that the smaller group used for the study (the sample) be truly representative of the larger group to whom the findings will be directed (the population). Preferably the sample group should be chosen at random.

12
Measurement Bias In a statistical study, it is important that the means of gathering measured data be reliable, accurate and appropriate for the study.

13
Try This: Example 1A A. The first 5 people leaving a movie theater at a sneak preview were asked how they liked the movie. People that went to the movie The first five people that left People that really enjoy a movie are less likely to be one of the first ones to leave. PopulationSamplePossible Bias Identify the population and the sample. Give a reason why the sample could be biased.

14
B. Eighth-grade students with a 3.0 GPA or higher were polled to determine how long students study each day. Eighth grade students Students with 3.0 or higher GPA Students with lower grades are less likely to study as long. Try This: Example 1B Identify the population and the sample. Give a reason why the sample could be biased. PopulationSamplePossible Bias

15
C. People attending a baseball game were asked if they support the construction of a new stadium in the city. City residents People attending a game People that attend a baseball game are more likely to support the construction of a new stadium. Try This: Example 1C Identify the population and the sample. Give a reason why the sample could be biased. PopulationSamplePossible Bias

17
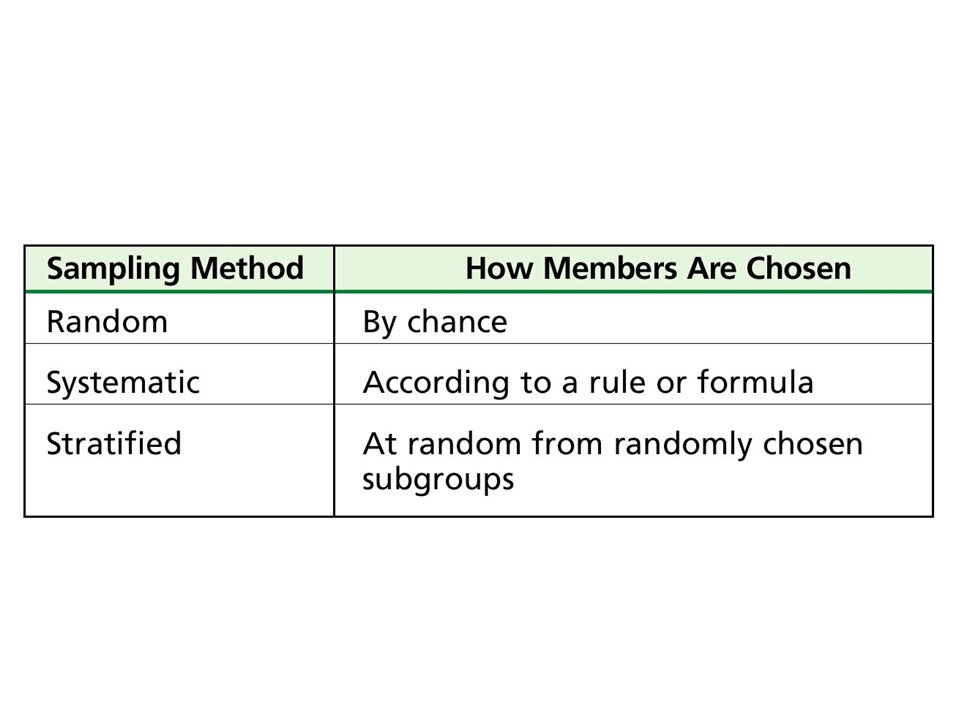
Random Example: – Survey people whose names were drawn out of a hat

18
Systematic Example – Select the number 5 at random; every 5 th person gets surveyed

19
Stratified Example – Separate a high school into four groups by grade level; survey a random sample of students from each grade

20
Identify the sampling method used. A. In a county survey, Democratic Party members whose names begin with the letter D are chosen. systematic The rule is to survey members whose names begin with D.

21
B. A telephone company randomly chooses customers to survey about its service. random Customers are chosen by chance. Identify the sampling method used.

22
C. A high school randomly chooses three classes from each grade and then draws three random names from each class to poll about lunch menus. stratified The three classes are the random subgroups. Names are chosen randomly from within the classes. Identify the sampling method used.

Similar presentations


>")
 or measurement.>")


