Download presentation
Presentation is loading. Please wait.

1
Statistics I ( 2-1)
")
4
What is Data? Consist of information coming from observations, counts, measurements, or responses. “People who eat three daily servings of whole grains have been shown to reduce their risk of…stroke by 37%.” (Source: Whole Grains Council) “Seventy percent of the 1500 U.S. spinal cord injuries to minors result from vehicle accidents, and 68 percent were not wearing a seatbelt.” (Source: UPI)
 Seventy percent of the 1500 U.S. spinal cord injuries to minors result from vehicle accidents, and 68 percent were not wearing a seatbelt. (Source: UPI).")
5
What is Statistics? The science of collecting, organizing, analyzing, and interpreting data in order to make decisions.

6
Data Sets Population The collection of all outcomes, responses, measurements, or counts that are of interest. Sample A subset of the population.

7
Example: Identifying Data Sets In a recent survey, 1500 adults in the United States were asked if they thought there was solid evidence for global warming. Eight hundred fifty-five of the adults said yes. Identify the population and the sample. Describe the data set. (Adapted from: Pew Research Center)
.")
8
Solution: Identifying Data Sets The population consists of the responses of all adults in the U.S. The sample consists of the responses of the 1500 adults in the U.S. in the survey. The sample is a subset of the responses of all adults in the U.S. The data set consists of 855 yes’s and 645 no’s. Responses of adults in the U.S. (population) Responses of adults in survey (sample)
 Responses of adults in survey (sample).")
9
Parameter and Statistic P arameter A number that describes a population characteristic. Average age of all people in the United States S tatistic A number that describes a sample characteristic. Average age of people from a sample of three states

10
Example: Distinguish Parameter and Statistic Decide whether the numerical value describes a population parameter or a sample statistic. 2.The 2182 students who accepted admission offers to Northwestern University in 2009 have an average SAT score of 1442. (Source: Northwestern University) Solution: Population parameter (the SAT score of 1442 is based on all the students who accepted admission offers in 2009)
 Solution: Population parameter (the SAT score of 1442 is based on all the students who accepted admission offers in 2009).")
11
Designing a Statistical Study 1. Identify the variable(s) of interest (the focus) and the population of the study. 2. Develop a detailed plan for collecting data. If you use a sample, make sure the sample is representative of the population. 3. Collect the data. 4. Describe the data using descriptive statistics techniques. 5. Interpret the data and make decisions about the population using inferential statistics. 6. Identify any possible errors.
 of interest (the focus) and the population of the study. 2. Develop a detailed plan for collecting data. If you use a sample, make sure the sample is representative of the population. 3. Collect the data. 4. Describe the data using descriptive statistics techniques. 5. Interpret the data and make decisions about the population using inferential statistics. 6. Identify any possible errors..")
12
Data Collection Observational study A researcher observes and measures characteristics of interest of part of a population. Researchers observed and recorded the mouthing behavior on nonfood objects of children up to three years old. (Source: Pediatric Magazine)
.")
13
Data Collection Experiment A treatment is applied to part of a population and responses are observed. An experiment was performed in which diabetics took cinnamon extract daily while a control group took none. After 40 days, the diabetics who had the cinnamon reduced their risk of heart disease while the control group experienced no change. (Source: Diabetes Care)
.")
14
Data Collection Survey An investigation of one or more characteristics of a population. Commonly done by interview, mail, or telephone. A survey is conducted on a sample of female physicians to determine whether the primary reason for their career choice is financial stability.

15
Example: Methods of Data Collection A study of the effect of eating oatmeal on lowering blood pressure is an example of experiment / observational study / survey ? Solution: Experiment (Measure the effect of a treatment – eating oatmeal)
.")
16
Example: Methods of Data Collection A study of how fourth grade students solve a puzzle is an example of: experiment / observational study / survey? Solution: Observational study (observe and measure certain characteristics of part of a population)
.")
17
Example: Methods of Data Collection A study of U.S. residents’ approval rating of the U.S president. is an example of: experiment / observational study / survey ? Solution: Survey (Ask “Do you approve of the way the president is handling his job?”)
.")
18
Summary

19
Example 1A Classify Study Types A.Determine whether the situation describes a survey, an experiment, or an observational study. Then identify the sample, and suggest a population from which it may have been selected. MOVIES A retro movie theater wants to determine what genre of movies to play during the next year. They plan to poll 50 random area residents and ask them what their favorite movies are. Answer: This is a survey, because the data are collected from participants' responses to the poll. The sample is the 50 people area residents that are polled, and the population is all area residents.

20
Example 1B Classify Study Types B.Determine whether the situation describes a survey, an experiment, or an observational study. Then identify the sample, and suggest a population from which it may have been selected. DRIVING A driving school wants to determine the main issue drivers face while taking the driving test. They watch and record 30 random people taking the test. Answer: This is an observational study, because the school is going to observe the drivers without their being affected by the study. The sample is the 30 drivers selected, and the population is all drivers that may take the test.

21
Example 1A A.survey B.experiment C.observational study A restaurant manager provides a new entrée to 30 randomly selected tasters and observes their reactions. Determine whether the situation describes a survey, an experiment, or an observational study.

22
Example 2A Choose a Study Type A.Determine whether the situation calls for a survey, an experiment, or an observational study. Explain your reasoning. VIDEO GAMES A gaming company plans to test whether a new controller is preferable to the old one. A group of teens will be observed while using the controllers, to see which one they use the most. Answer: The teens will be observed without being affected by the study, so this is an observational study.

23
Example 2B Choose a Study Type A.Determine whether the situation calls for a survey, an experiment, or an observational study. Explain your reasoning. RESTAURANTS A restaurant wants to conduct an online study in which they will ask customers whether they were satisfied with their dining experience. Answer: This situation calls for a survey because members of the sample population are asked for their opinion.

24
A.Survey; members of the sample are observed and asked their opinions. B.Experiment; members of the sample are observed and affected by the study. C.Observational study; members of the sample are observed and unaffected by the study. D.Experiment; members of the sample are treated and affected by the study. Determine whether the situation calls for a survey, an experiment, or an observational study. Explain your reasoning. MOVIES A production studio played a movie for a test audience and watched their reactions.

25
Additional Essential Question Explain whether the situation is an experiment or an observational study. A researcher asks people how many hours they exercise per week and examines whether this affects the amount of sleep they get. A- This is an experiment. The researcher gathers data instead of applying a treatment. B- This is an observational study. The researcher gathers data instead of applying a treatment. C- This is an experiment. The researcher is applying a treatment (exercise) instead of simply gathering data. D- This is an observational study. The researcher is applying a treatment (exercise) instead of simply gathering data.
 instead of simply gathering data. D- This is an observational study. The researcher is applying a treatment (exercise) instead of simply gathering data..")
26
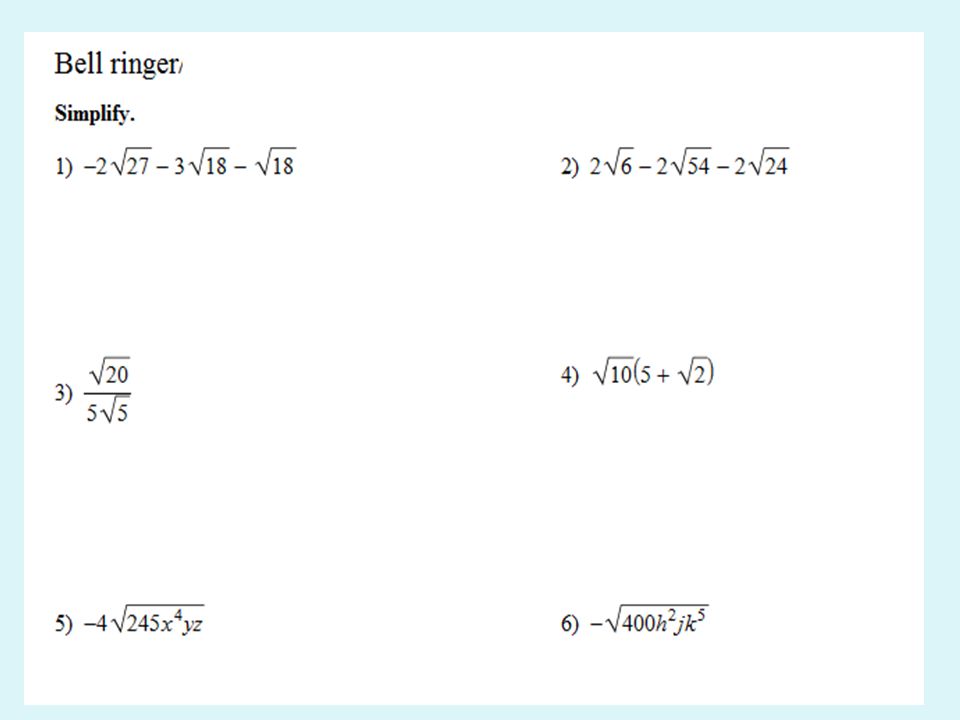
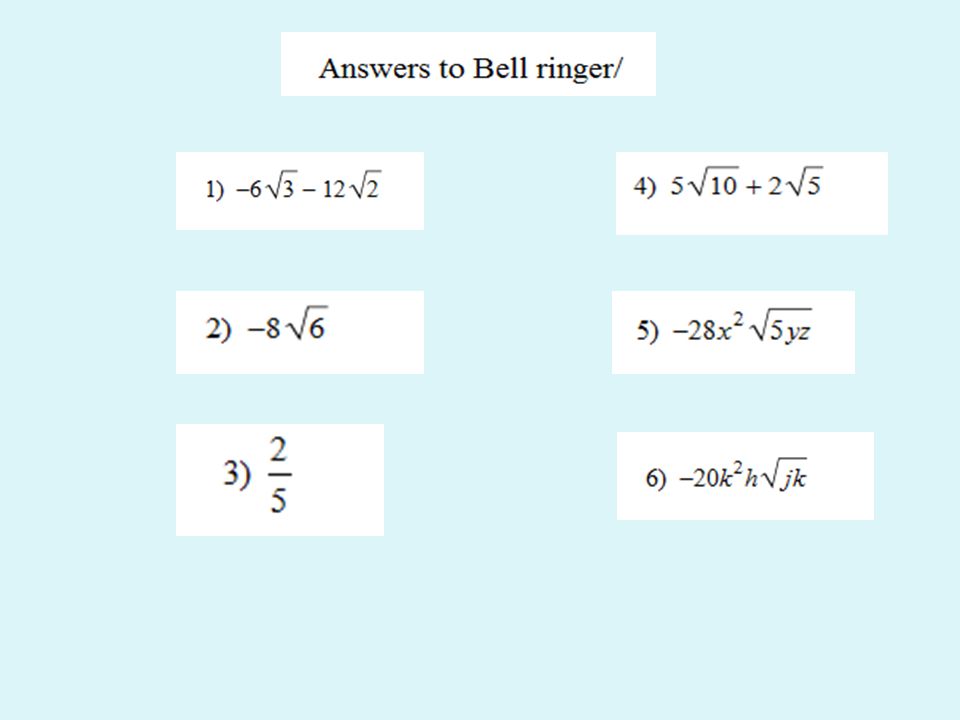
Let’s Practice… Pg. 3 # 1-3 Pg. 4 # 1, 2

Similar presentations


 of interest (the focus) and the population of the study. 2. Develop a detailed plan for collecting data. Make sure sample.>")


