Download presentation
Presentation is loading. Please wait.

1
The North Atlantic Inflow to the Arctic Ocean from observations and high ‐ resolution modelling Yevgeny Aksenov 1, Sheldon Bacon 1, George Nurser 1, Vladimir Ivanov 2,3, Andrew Coward 1 and Igor Polyakov 4 1 National Oceanography Centre Southampton, UK 2 Scottish Assocation fro Marine Science, UK 3 Arctic and Antarctic Research Institute, Russia 4 International Arctic Research Centre, USA Arctic Model Intercomparison Project 21-23/10/09 Woods Hole Oceanographic Institution, MA, USA

2
Approach Use model(s) and observations to understand the routes of the North Atlantic inflow to the Arctic Methods: eddy-permitting model (OCCAM 1/12°) and Nansen Amundsen Basin Observing System (NABOS) sections + current -meter M1, 2002-2006.
 and observations to understand the routes of the North Atlantic inflow to the Arctic Methods: eddy-permitting model (OCCAM 1/12°) and Nansen Amundsen Basin Observing System (NABOS) sections + current -meter M1,")
3
Extended oceanographic studies during IPY provided exceptional coverage of the Arctic Ocean by CTD observations. 10 sequential cross-slope sections between 43 0 E and 185 0 E (NABOS + AARI, Russia +AWI, Germany) were used to calculate ‘west-east’ changes in heat content of AW and overlying ‘pycnocline/halocline’ layer Variation of heat content, normalized by the layer thickness, in the Atlantic Water (AW ) and in the overlaying layer (OL), summer 2007 Heat content density (MJ/m3) in AW and overlaying water T-z and T-σ t temperature profiles averaged over cross-slope sections Courtesy Vladimir Ivanov (SAMS/AARI) and Igor Polyakov (IARC) Downstream AW gets deeper and colder, whereas OL gets warmer. The AW heat becomes available to melt sea ice.
 were used to calculate ‘west-east’ changes in heat content of AW and overlying ‘pycnocline/halocline’ layer Variation of heat content, normalized by the layer thickness, in the Atlantic Water (AW ) and in the overlaying layer (OL), summer 2007 Heat content density (MJ/m3) in AW and overlaying water T-z and T-σ t temperature profiles averaged over cross-slope sections Courtesy Vladimir Ivanov (SAMS/AARI) and Igor Polyakov (IARC) Downstream AW gets deeper and colder, whereas OL gets warmer. The AW heat becomes available to melt sea ice..")
4
OCCAM Model 1/12º (~8 km), 66 levels, eddy permitting in the central Arctic Ocean EVP + Semtner Forcing: NCEP reanalysis fields 1985-2006 Surface salinity restoring to World Ocean Atlas (WOA), 40 days Initial conditions WOA+PHC, snow and sea ice from Romanov’s Atlas and NSIDC
, 66 levels, eddy permitting in the central Arctic Ocean EVP + Semtner Forcing: NCEP reanalysis fields Surface salinity restoring to World Ocean Atlas (WOA), 40 days Initial conditions WOA+PHC, snow and sea ice from Romanov’s Atlas and NSIDC")
5
Potential Temperature and velocity at 166 m in the Nordic Seas, OCCAM 1/12°, 1989-2004 One out of sixteen velocity nodes per area is shown.

6
Modelled (OCCAM 1/12°) and observed AW oceanic fluxes in the Nordic Seas, 1989-2004 One out of sixteen velocity nodes per area is shown. 0.8 Sv 18 TW T ≥ 1°C S≥34.8 T ≥ 1°C S≥34.8 3.1 Sv 104 TW 136 TW 156 TW 5.6 Sv 160 TW 6.5 Sv 148 TW 5.1 Sv 118 TW 3.1 Sv 45 TW 3.6 Sv 44 TW 5.3 Sv 111 TW 7.2 Sv 158 TW 1.0 Sv 13 TW 3.4 Sv 3.8 Sv 134 TW 6.5 Sv 133 TW Green-Nor: AW 253 TW Green-Nor: AW 253 TW Fram Strait: AW 45 TW Fram Strait: AW 45 TW

7
One out of sixteen velocity nodes per area is shown. Atlantic Inflow through the Barents Sea and Fram Strait, OCCAM 1/12°, 1989-2004

8
Modelled and observed AW oceanic fluxes, 1989-2004 One out of sixteen velocity nodes per area is shown. T ≥ 1°C S≥34.8 T ≥ 1°C S≥34.8 1.7 Sv 44 TW 48 TW 0.1 Sv ??? Sv 1 TW ? TW -0.1 Sv ??? Sv -1 TW ? TW 0.0 Sv ??? Sv 0 TW ? TW 3.1 Sv 3.6 Sv 45 TW 44 TW Green-Norw: AW 253 TW Green-Norw: AW 253 TW Fram Strait: AW 45 TW Fram Strait: AW 45 TW Barents-Kara: AW 0 TW Barents-Kara: AW 0 TW 0.4 Sv ??? Sv 1 TW ? TW 1.4 Sv 1.5 Sv -5 TW -4 TW 1.4 Sv 1.5 Sv -4 TW

9
Convection and Mixed Layer Depth in the Barents Sea, OCCAM 1/12° MLD at full-depth convective sites MLD (black) and ice production (red) at St. Anna Trough MLD at intermediate-depth convective sites.

10
AW modification in the Barents Sea and Fram Strait, OCCAM 1/12°, 1989-2004 AW surface cooling loss: 0.33 Sv AW Mixing loss : 1.37 Sv AW surface cooling loss: 0.33 Sv AW Mixing loss : 1.37 Sv

11
AW in the Laptev Sea (126°E) 126°E
 126°E")
12
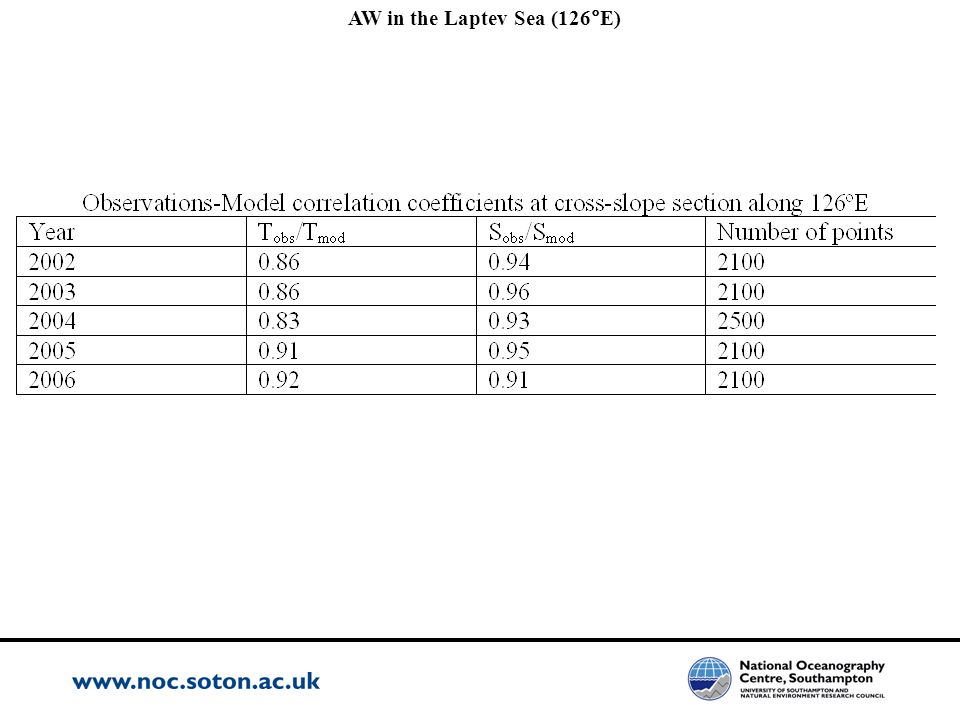
AW in the Laptev Sea (126°E)
")
14
Modelled AW Core in the Laptev Sea (126°E) T, S and Vcross do not co-incide T core is slower then Vcore Are measurements of Tmax misleading? T, S and Vcross do not co-incide T core is slower then Vcore Are measurements of Tmax misleading?

15
2004 AW in the Laptev Sea (126°E) 126°E M1
 126°E M1")
16
Summary We used high-resolution model and observations to analyze the Atlantic Inflow: Large heat loss in the Nordics Seas, Most of the heat comes to the Arctic through Fram Strait Atlantic Water is modified in the Barents Sea through mixing 1.37 Sv and cooling 0.33 Sv; outflow from the Barents Sea has T <0°C Data and model produce a reasonable agreement Maximum T, S and velocity cores of the AW flow along the Siberian Shelf do not coincide: are we measuring in the wrong place?

Similar presentations

 Andrej Rubchenia Dr. Vladimir Pavlov (NPI) Long-period variability of thermohaline structure and circulation of water.>")


Model forcing validation.>")


