Download presentation
Presentation is loading. Please wait.

1
Energy Savings & TV White Spaces Prof George Kormentzas, University of the Aegean

2
2 Presentation Outline ICT Energy Efficiency TV White Spaces Notion TVWS Resource Management Backtracking Pruning Simulated Annealing Genetic Algorithm Implementation Models Profitability analysis

3
The Energy Challenge The Grand Challenge: to spend less energy while maintaining an equivalent level of economic activity or service EU 2020 initiative: 20% energy savings by 2020 Costs €67 billions, or 0.5% of EU GDP US vision for 2025: A Framework for Change Up to 50% energy savings in homes 10%+ energy savings in industries

4
Energy efficiency & ICT Currently, 3% of the world-wide energy is consumed by the Information and Communication Technologies (ICT) infrastructure which causes about 2% of the worldwide CO 2 emissions comparable to the world-wide CO 2 emissions by airplanes or ¼ of the world-wide CO 2 emissions by cars The transmitted data volume increases approximately by a factor of 10 every 5 years
 infrastructure which causes about 2% of the worldwide CO 2 emissions comparable to the world-wide CO 2 emissions by airplanes or ¼ of the world-wide CO 2 emissions by cars The transmitted data volume increases approximately by a factor of 10 every 5 years")
5
The Global ICT footprint ICT includes PCs, telecom networks and devices, printers and data centers GtCO 2 e

6
The Global ICT Footprint by sector

7
ICT vs developing countries

8
The mobile revenue gap

9
Energy consumption of telcos 2.1 TWh 3.7 TWh 4.5 TWh 9.9 TWh

10
Per-user power reduced by 20% @ 2020 (vs.2006) CO2 emission in 2010 lower 50% than 1995 Energy consumption per unit in 2011 lower by 40% than that of 2005 Improve equipment EE by 30% energy saving Operators’ demand
 CO2 emission in 2010 lower 50% than 1995 Energy consumption per unit in 2011 lower by 40% than that of 2005 Improve equipment EE by 30% energy saving Operators’ demand")
11
Manufacturers’ demand

12
Why wireless? Another viewpoint 15 billion apps downloaded by Apple Store (June 2011) 32 million apps / day
 32 million apps / day.")
13
4G users will be left searching for power outlets rather than network access !!! Users’ demand

14
Typical Power Consumption (Mobile Operator) S. Vadgama, “Trends in Green Wireless Access,” Fujitsu Scientific and Technical Journal (FSTJ), Oct. 2009
, Oct")
15
The advent of the green radio Green Radio Hot topic Social Concern Global Energy CostIndustry

16
Background and Motivation Spectrum utilisation studies have shown that most of the licensed frequencies are under-utilised, and significant part of radio spectrum is available when both dimensions of space and time are considered Such an example of under-utilised spectrum is the Television White Spaces “TVWS” TVWS consist of VHF/UHF frequencies: A. That are released by the digital switchover process, known as “Spectrum Dividend” B. That are completely unexploited (especially at local level) due to frequency planning issues and/or network design principles, known as “Interleaved Spectrum”
 due to frequency planning issues and/or network design principles, known as Interleaved Spectrum .")
17
17 In Europe the complete digital switch over is planned for 2012 and will open a “once in a lifetime” opportunity for the network of the future. By switching from analogue to digital transmission more television channels can be broadcast using less spectrum. After analogue switch off the spectrum 790 MHz to 862 MHz (ch. 61 to 69), the so called digital dividend, will be/was entirely cleared from broadcast. Digital Dividend Motivation DTV primary, PMSE secondary Future Mobile Communication (IMT) Digital Dividend
, the so called digital dividend, will be/was entirely cleared from broadcast. Digital Dividend Motivation DTV primary, PMSE secondary Future Mobile Communication (IMT) Digital Dividend.")
18
18 Digital Dividend Motivation Within the remaining spectrum (470 MHz to 790 MHz) not all channels are occupied at each location. This locally unused channels are called TV White Spaces (TVWS). How to transform the TV White Spaces into social benefits and economic growth ? DTV primary, PMSE secondary Future Mobile Communication (IMT) Digital Dividend
. How to transform the TV White Spaces into social benefits and economic growth . DTV primary, PMSE secondary Future Mobile Communication (IMT) Digital Dividend.")
19
19 TVWS-Interleaved Spectrum

20
Background and Motivation TVWS are well-suited for wireless applications and mobile telecommunication systems Low cost and low power system design Superior propagation conditions Strong interest by Mobile Communication Network operators

21
21 Why TVWS are so valuable ? TVWS are quite stable because terrestrial broadcasting is planned around relatively inflexible ‘ high power – high tower’ distribution networks. Strong interest by Mobile Communication Network operators to lower frequencies, as network rollouts costs are dramatically lower. 2.6 GHz coverage700 MHz coverage

22
22 Attractiveness of TV White Spaces Broadcaster operation can be protected by a geo-location database with a list of vacant channels and associated transmit powers (FCC, OFCOM). However database cannot protect all Wireless Microphones applications. Deadlock: the only practical solution is move WM to “safe harbor” channels, reallocation costs.

23
Background and Motivation TVWS can be exploited using Cognitive Radio (CR) technologies. CR technologies aim to: Provide dynamic spectrum access to unlicensed users, by avoiding interference to licensed ones Develop radio and frequency agile terminals Frequency agile terminals are capable to: Sense the unused portions of radio spectrum Dynamically adapt their transitions parameters to the TVWS characteristics Guarantee the QoS, utilising interference avoidance techniques

24
Background and Motivation The traditional command-and-control spectrum-administration policy: Permits only licensed systems/users, such as DVB-T, DVB-H, iTV, etc., to exploit TVWS Prohibits any other opportunistically unlicensed transmission There is a global recognition that the current regulatory model is no longer optimal and new spectrum models have to be adopted The new spectrum models have to permit the exploitation of the radio spectrum to licensed systems as well as to unlicensed ones New Regulatory Models: Spectrum of Commons Real-time Secondary Spectrum Market

25
Background and Motivation Secondary systems in “Spectrum of Commons” Coexist with primary via control of interference Exploit sensing techniques - coexistence mechanism Opportunistically operate Fulfill rules – no need to negotiate with the licensed ones There is no spectrum manager – Ad-hoc implementations Provide fairness Efficiency - QoS cannot be guaranteed Users Intra-system Communication

26
Background and Motivation Secondary systems in “RTSSM” Coexist with primary via fixed-assignments Dynamically request access when-and-only-when spectrum is needed Adopts spectrum trading Allows secondary players to buy spectrum usage rights – Secondary Market Spectrum trading is performed via «Spectrum Broker» - determines financial transactions – Centralized implementations Efficiency – QoS can be guaranteed Spectrum Broker Users Service Provider Trading Inter-system Communication RRM

27
27 Removing the bureaucracy of the trading process Spectrum Leasing (COGEU approach): removes the NRA from much of the bureaucracy of the trading process, developed under Article 9(b) of Directive 2009/140/EC
: removes the NRA from much of the bureaucracy of the trading process, developed under Article 9(b) of Directive 2009/140/EC")
28
28 Measurements campaign in TV bands

29
29 TVWS availability in Munich area (preliminary results, max. allowed power to be computed). TV white spaces characterization (0: Channel occupied by DVB-T; Low: Adjacent channel with low power; Max.: Free DVB-T channel)
. TV white spaces characterization (0: Channel occupied by DVB-T; Low: Adjacent channel with low power; Max.: Free DVB-T channel).")
30
30 TVWS maps – illustrative results

31
31 TVWS maps

32
Broker-based Spectrum Allocation The Spectrum Broker is making decisions regarding the spectrum portions that can be allocated to secondary systems Availability of TVWS from Geo-location DB Financial Data and Regulations Spectrum Broker TVWS Allocation to Secondary Systems Secondary System Technical Characteristics Secondary System Request for available TVWS Trading RRM

33
Secondary Spectrum Market Model

34
Logical Diagram – Preparation & Analysis Phase

35
Logical Diagram – Trading Phase

36
Algorithms for RRM & Trading Implementations Backtracking Generate all possible spectrum allocations: Exactly once By performing exact search The constraint validity of allocation solution is checked If the solution violates any of the constraints, backtracking rejects this one Pruning The backtracking algorithm may be improved by some filtering techniques, which aim at pruning the search space in order to decrease the overall duration of the search

37
Algorithms for RRM & Trading Implementations Simulated Annealing The current allocation solution is replaced by a random “nearby” solution, at each iteration This allocation solution is chosen with a probability that depends on the difference between the corresponding function values based on spectrum fragmentation and utilisation This algorithm searches randomly solutions, in order to avoid local optimum solutions Genetic Algorithm This algorithm begins with a sample set of potential solutions. It then evolves towards a set of more optimal solutions A little random mutation helps guarantee that a set of solutions will not reach to local optima and simply fill up with numerous copies of the same solution

38
① Performance Evaluation of the Optimization Algorithm ② Performance Evaluation - Quantitative and Qualitative Comparison of Spectrum Broker pricing models Performance Evaluation – Indicative Results 626-632 MHz 746-752 MHz

39
Performance Evaluation of the Optimization Algorithm (1/2) TVWS exploitation for spectrum trading under a fixed-price mode, where: A number of secondary systems randomly competing/requesting for available TVWS. For every new time period of the simulation, the secondary systems were entering the test-bed Operating under different technologies/technical requirements (i.e. LTE (TDD), WiFi, Public Safety) Exploiting a different QoS-level requirement, thus the optimisation algorithm was also taking into account this parameter during the spectrum allocation process under a real-time procedure. Utilising system-spacing of at least 1MHz TVWS availability ranges from 626MHz (Ch.40) to 752MHz (Ch.60)
, WiFi, Public Safety) Exploiting a different QoS-level requirement, thus the optimisation algorithm was also taking into account this parameter during the spectrum allocation process under a real-time procedure. Utilising system-spacing of at least 1MHz TVWS availability ranges from 626MHz (Ch.40) to 752MHz (Ch.60).")
40
Performance Evaluation of the Optimization Algorithm (2/2) Three versions of the proposed decision-making process are implemented: 1 st by exploiting the Backtracking algorithm and Pruning feature, 2 nd by utilising the Simulated Annealing 3 rd by developing the Genetic Algorithm
 Three versions of the proposed decision-making process are implemented: 1 st by exploiting the Backtracking algorithm and Pruning feature, 2 nd by utilising the Simulated Annealing 3 rd by developing the Genetic Algorithm")
41
Performance Evaluation - Quantitative and Qualitative Comparison of Spectrum Broker pricing models (1/5) TVWS exploitation for spectrum trading under both fixed-price and auction-based modes Fifty LTE secondary systems are randomly competing/requesting for available TVWS. For every new time period of the simulation, the secondary systems were entering the test-bed Operating under same technologies with different technical requirements (i.e. LTE (TDD) of 5, 10 and 20MHz) Exploiting a different QoS-level requirement, thus the optimisation algorithm was also taking into account this parameter during the spectrum allocation process under a real-time procedure. Utilising system-spacing of at least 1MHz
 of 5, 10 and 20MHz) Exploiting a different QoS-level requirement, thus the optimisation algorithm was also taking into account this parameter during the spectrum allocation process under a real-time procedure. Utilising system-spacing of at least 1MHz.")
42
Performance Evaluation - Quantitative and Qualitative Comparison of Spectrum Broker pricing models (2/5) Four time-auctions/allocation per hour, (each one of 15-minutes long intervals) was set The available TVWS based on Munich maps of Ch.40 - Ch.60 are ten (see figure below), while the number of frequency-time slots are forty The same number of TVWS can be leased/allocated to more than one LTE base station, based on the re-used distance and on condition that no interference is caused A single spectrum-unit price (i.e. per 1MHz) that was applied for every TVWS frequency trading process, considering parameters, such as benchmark price, price factor over year, population density, allocation area, degree of competition, incentives of operators in low/medium/high density areas and traffic conditions (i.e. low/medium/high)
 that was applied for every TVWS frequency trading process, considering parameters, such as benchmark price, price factor over year, population density, allocation area, degree of competition, incentives of operators in low/medium/high density areas and traffic conditions (i.e. low/medium/high).")
43
Performance Evaluation - Quantitative and Qualitative Comparison of Spectrum Broker pricing models (3/5) The test-bed exploiting the Simulated Annealing algorithm The performance evaluation considering a quantitative and qualitative comparison among both algorithms, as a matter of : Spectrum utilization Spectrum fragmentation The average values of spectrum broker benefit/utility Probability of accessing TVWS
 The test-bed exploiting the Simulated Annealing algorithm The performance evaluation considering a quantitative and qualitative comparison among both algorithms, as a matter of : Spectrum utilization Spectrum fragmentation The average values of spectrum broker benefit/utility Probability of accessing TVWS")
44
Performance Evaluation - Quantitative and Qualitative Comparison of Spectrum Broker pricing models (4/5) Auctions: Spectrum Broker profit vs. Spectrum Fragmentation Fixed Price: Spectrum Fragmentation vs. Spectrum Broker profit NOTE: As the number of secondary systems is getting higher, the number of guard intervals also increases, resulting to a higher radio spectrum fragmentation, after frequency allocation process Average Spectrum Broker Benefit (KEuro) Number Secondary Systems Average Spectrum Fragmentation Number Secondary Systems
 Number Secondary Systems Average Spectrum Fragmentation Number Secondary Systems.")
45
Performance Evaluation - Quantitative and Qualitative Comparison of Spectrum Broker pricing models (5/5) Possibility of a secondary system permitted to operate, exploiting TVWS Results implies that bidders are encouraged to participate in the auction-based process, increasing the possibility to access the available TVWS Number Secondary Systems Average Spectrum Utilization % Average Probability of using TVWS
 Possibility of a secondary system permitted to operate, exploiting TVWS Results implies that bidders are encouraged to participate in the auction-based process, increasing the possibility to access the available TVWS Number Secondary Systems Average Spectrum Utilization % Average Probability of using TVWS")
46
46 Spectrum-aware routing protocols – Challenges Key issues: Route “Quality” Route Maintenance Spectrum Awareness

47
Enhancing the proposed architecture Intra-system communication Conventional routing protocols that utilise network-wide broadcast messages over a Common Control Channel (CCC), without using any local hops information Inter-system communication Spectrum availability in an inter- system CR network highly depends on the primary users’ presence A Common Control Channel (CCC) to be used in order to establish and maintain a fixed routing path between secondary users Requires more sophisticated network-layer mechanisms (i.e. routing protocols) that provide for “spectrum mobility”
 that provide for spectrum mobility .")
48
Enhancing the proposed architecture A novel routing protocol for ad-hoc CR networks Availability of spectrum in specific geographical locations at local level Secondary systems located in regions of heterogeneous spectrum availability Without direct communication link between the secondary users The protocol establishes the best routing path considering Traffic redirection, in case of route failure in the path Load balancing, for determining which neighbouring node performs better in the routing path, or for mitigating traffic in cases of overloading

49
Initial approach Published in Conferences: FUNEMS 2012, TEMU 2012

50
Routing integrated with load management

51
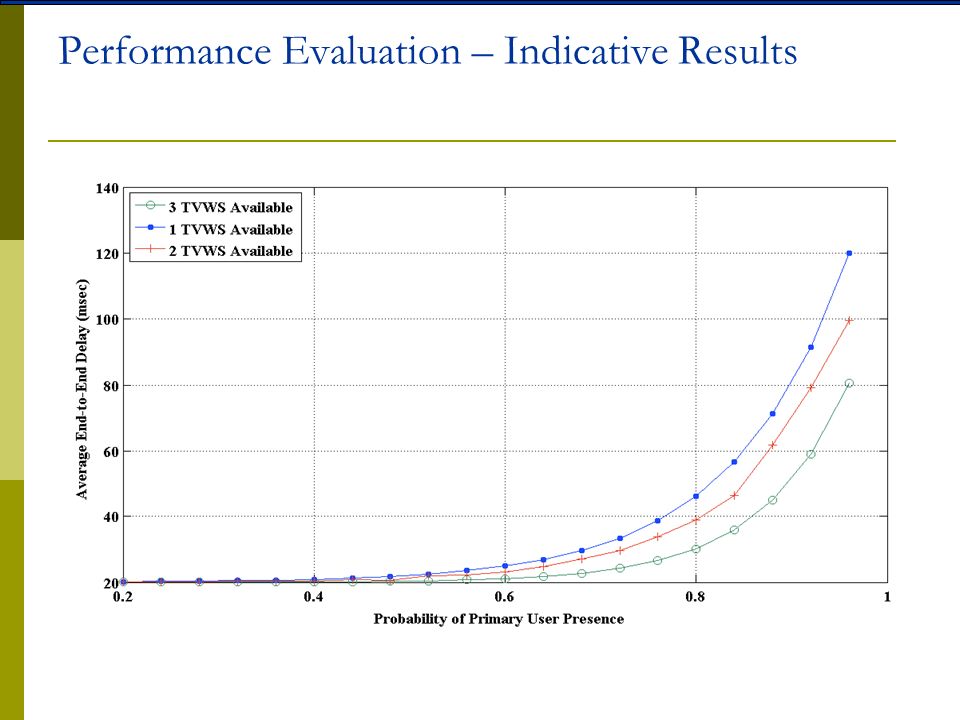
Metrics for performance evaluation Switching Delay (D switching ) occurs when a secondary user during the routing path switches from one channel to another Medium Access Delay, namely Backoff Delay (D backoff ) is defined as the time from the moment that a data flow is ready to be transmitted up to the moment the data transmission is successfully initiated Queuing Delay (D queuing ) is based on the output transmission capacity of a secondary user on a given channel. More specifically, queuing delay represents the time needed for a data flow to wait in a queue until it can be processed End-to-end Delay (D end-to-end ) is the summary of the above metioned delay metrics for each flow
 is the summary of the above metioned delay metrics for each flow.")
52
Simulation Conditions The available TVWS, are channels 57, 59 and 60 with max. allowable transmission power of over 20dBm Up to 50 secondary nodes are randomly scattered in the selected area Pair nodes of S1 − D1 up to S10 – D10 are the flows that obtained for the protocol simulation under heavy load Simulation Topology - Area of Munich in Urban (2.2Km x 2.2Km)
.")
53
Performance Evaluation – Indicative Results

57
“Protocol to Access White Space Device and White Space Database”. The proposed protocol allows any WSD to gain access to services of the geo-location database, by communicating over commonly used Internet protocols. PAWS implementation for COGEU is suitable for both models of spectrum broker and spectrum of commons. The COGEU-PAWS (i.e., three services) is online available for testing at the COGEU geo-location database. Implemented solution based on IETF PAWS
 is online available for testing at the COGEU geo-location database. Implemented solution based on IETF PAWS.")
58
Service 1: Registration A fixed WSD register to Geo-location database prior to operating for the first time, or after changing location, or if any of the registration data changes. To successfully register, the ID and Serial Number of the WSD must be enrolled at the geo-location database. Implemented solution based on IETF PAWS

59
Service 2: Channel List Request Service 3: ID Verification Implemented solution based on IETF PAWS

60
Spectrum Broker Profitability Analysis Spectrum product for sell 30 dBm transmission power (from Munich dB) which allows for 1 km radius of cell 1 year allocation license allocation period: 8 hours Average price 80 € /MHz Average price 160 € /MHz Average price 240 € /MHz 30 base stations Not profitable 50 base stations Not profitable 88000 60 base stations Not profitable 30400145600 100 base stations Not profitable 184000376000
 which allows for 1 km radius of cell 1 year allocation license allocation period: 8 hours Average price 80 € /MHz Average price 160 € /MHz Average price 240 € /MHz 30 base stations Not profitable 50 base stations Not profitable base stations Not profitable base stations Not profitable")
61
For the Munich scenario the expected profitability of the spectrum broker income can be achieved when the average price for spectrum unit (1 MHz, one year license, 8h/day period, per site) exceeds 100€ considering a rational number of base stations. As the broker’s profitability depends on the DVB-T protection criteria (set by the regulator), the secondary players interests, the spatial TVWS distribution and the technology constraints (e.g. availability of LTE-A carrier aggregation), is very likely that the broker’s profitability cannot be guaranteed considering only a limited operational area. Therefore the broker is expected to expand the operational area (beyond Munich) and the frequency band (beyond TV UHF spectrum). It was demonstrated that an auction mechanisms that takes in consideration the carrier aggregation features of the LTE-A system, allows for better resource utilization of TVWS and for higher auction efficiency of the COGEU model. Spectrum Broker Profitability Analysis
, the secondary players interests, the spatial TVWS distribution and the technology constraints (e.g. availability of LTE-A carrier aggregation), is very likely that the broker’s profitability cannot be guaranteed considering only a limited operational area. Therefore the broker is expected to expand the operational area (beyond Munich) and the frequency band (beyond TV UHF spectrum). It was demonstrated that an auction mechanisms that takes in consideration the carrier aggregation features of the LTE-A system, allows for better resource utilization of TVWS and for higher auction efficiency of the COGEU model. Spectrum Broker Profitability Analysis.")
Similar presentations


 Juan Carlos Zuniga (Interdigital) IETF 82.>")
>")


 Laboratory Department of Digital Systems University of Piraeus Research Center (UPRC) University.>")


 1.>")


 Chaitanya Nettem Rawad Habib 2015.>")
