Download presentation
Presentation is loading. Please wait.

1
National Findings

2
Most Comprehensive Study Ever All 50 States + D.C.

3
Arts and the “Great Recession” Changes between 2005 and 2010 Unemployment 5.1% to 9.7% Consumer Confidence 101 to 54 Home Foreclosures Tripled: 885,000 to 2.9 million Spending on recreation, entertainment, shopping: $192 to $164 billion Live attendance: arts and sports Jobs in tourism, food & beverage

4
How a Dollar is Re-Spent in a Community...

5
Economic Impact of Nonprofit Arts & Culture Industry $135.2 Billion Annual Expenditures (2010)
")
6
Organizations Spent... $61.1 Billion

7
1.1 Million Jobs Supported Directly by Nonprofit Arts Organizations

8
Nonprofit Arts Attendees Spend $24.60 Per Person, Per Event

9
Nonprofit Arts & Culture Attendees Local vs. Nonlocal

10
Event-Related Spending Local vs. Nonlocal Audiences 59.4 percent of nonlocal attendees said: “this arts event is their primary purpose for their trip.”

11
Will You Travel for a Cultural Experience? Q: If this event were not happening, would you have traveled to another community to attend a similar cultural experience? 30.8% 27.0% 29.6% 27.7% 20.6% 25.4% 41.5% 52.3% 45.0%

12
Audiences spent... $74.1 Billion

13
Nonprofit Arts & Culture Industry Organizations$61.1 Billion Audiences$74.1 Billion Total$135.2 Billion Supports 4.1 million FTE jobs Generates $22.3 billion in government revenue

14
Arts Volunteerism Average community: 5,215 arts volunteers who donated 201,719 hours ($4.3 million value) Average organization: 45 volunteers who donated 72 hours each Value of 2010 volunteer hour = $21.36
 Average organization: 45 volunteers who donated 72 hours each Value of 2010 volunteer hour = $21.36")
15
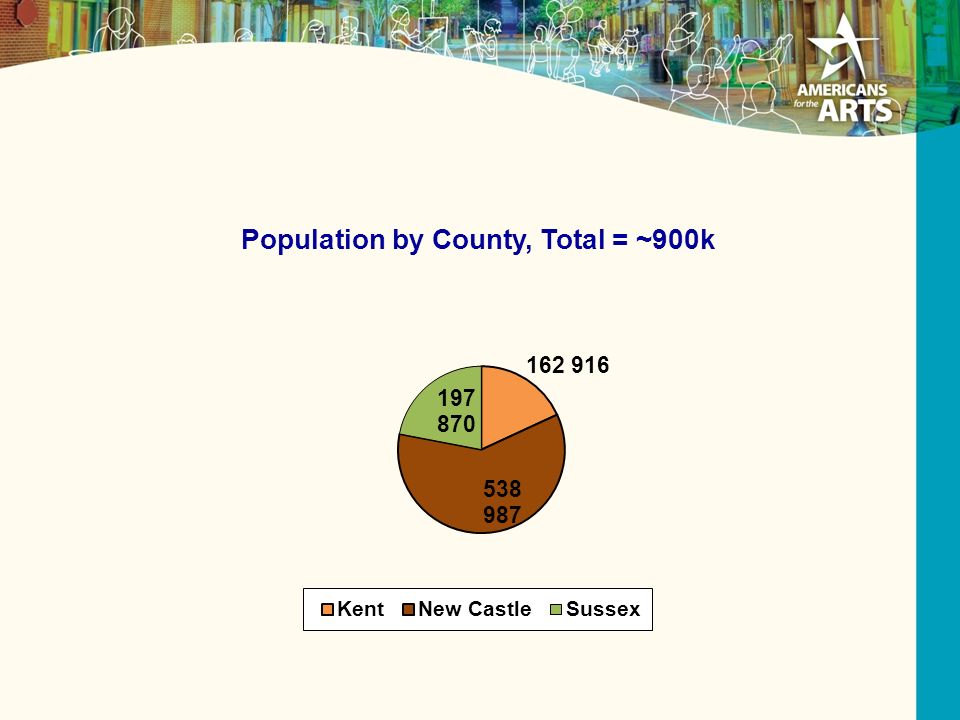
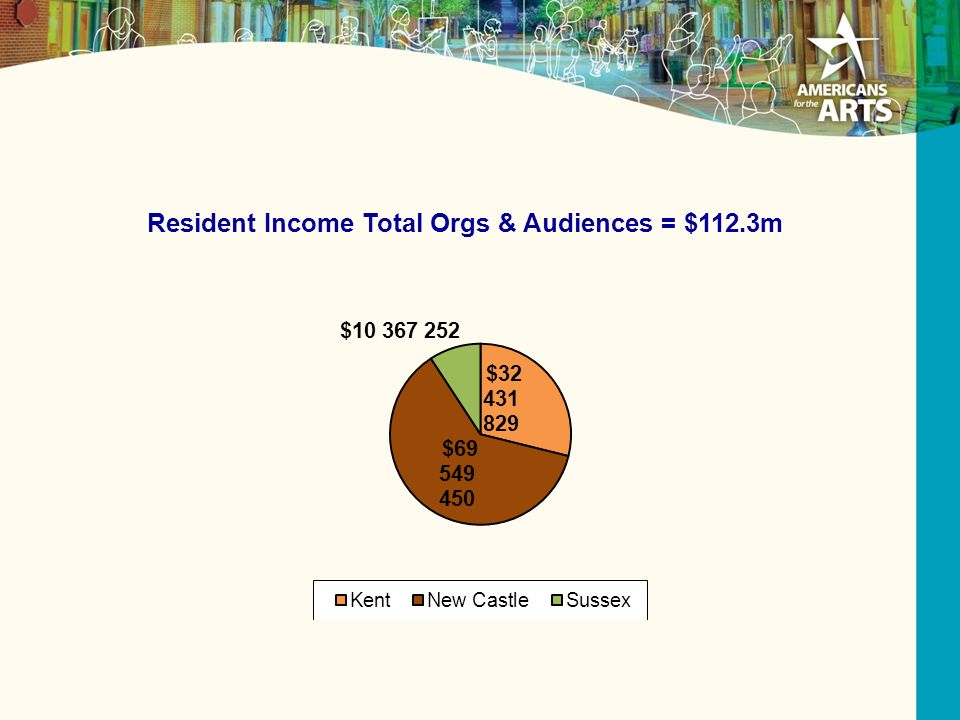
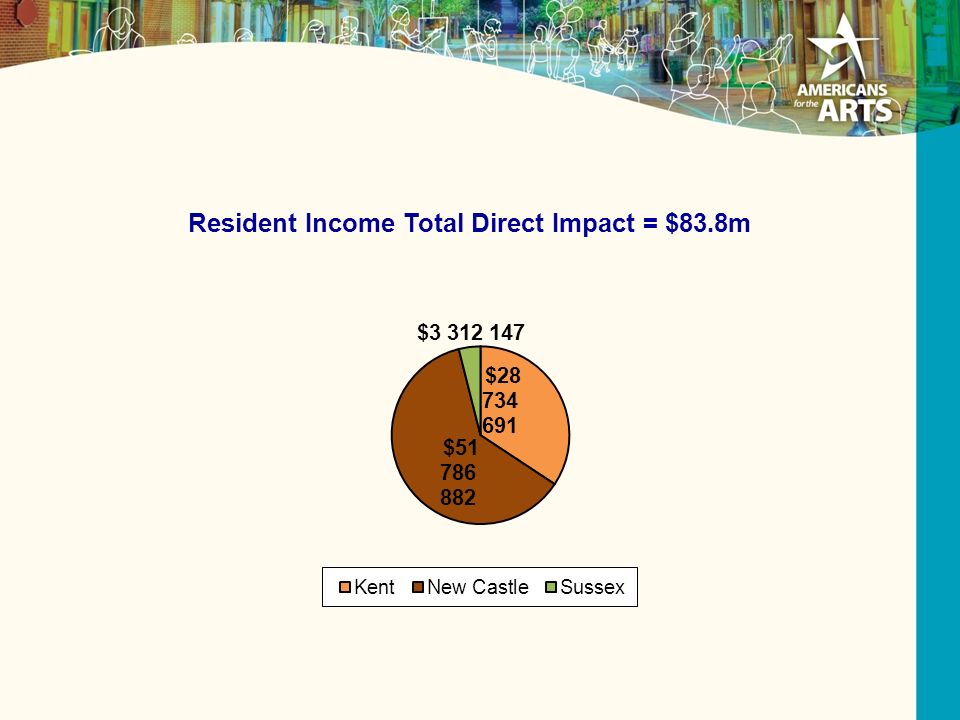
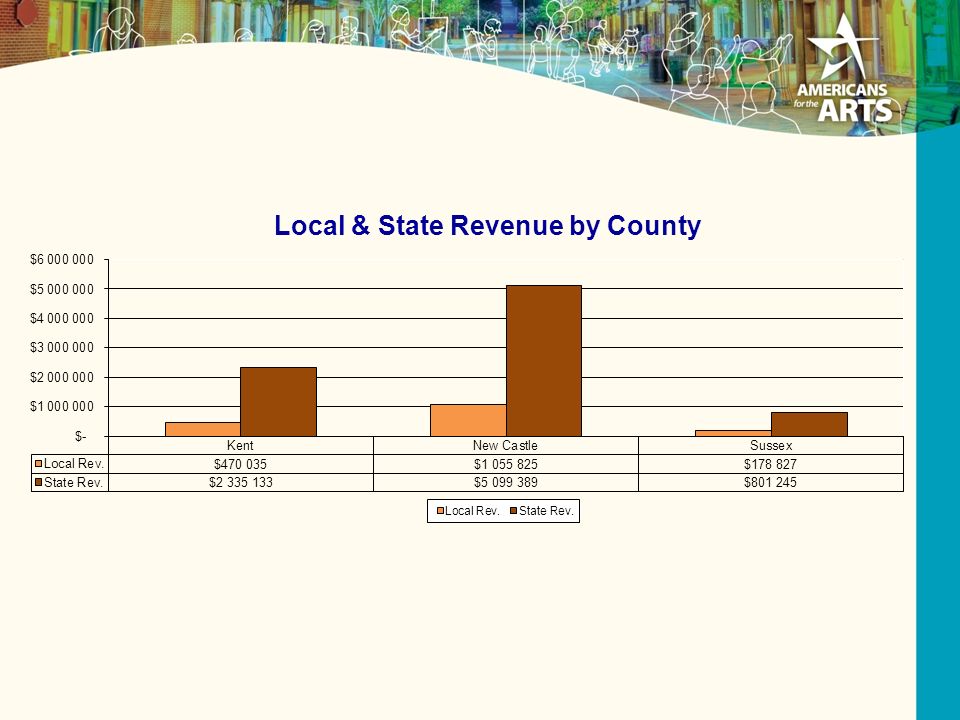
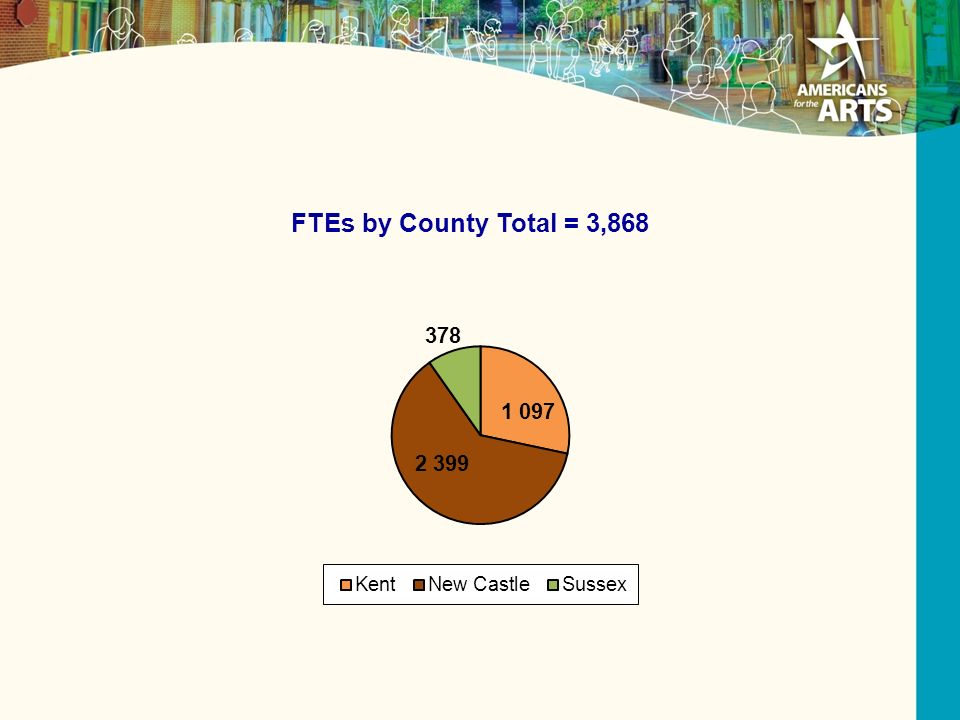
Economic Impact of Nonprofit Arts & Culture Industry $142.4 Million Annual Expenditures (2010) (Delaware) Full-time equivalent jobs3,868 Resident Household Income$112,337,000 Local Government Revenue$1,704,000 State Government Revenue$8,235,000
 (Delaware) Full-time equivalent jobs3,868 Resident Household Income$112,337,000 Local Government Revenue$1,704,000 State Government Revenue$8,235,000")
16
Nonprofit Arts & Culture Industry Organizations$103.4 Million Audiences$ 38.9 Million Total$142.3 Million Supports 3,868 FTE jobs Generates $9.9 million in government revenue

17
Local vs. Nonlocal Attendees in Delaware

18
Event-Related Spending Local vs. Nonlocal Audiences 79.2 percent of nonlocal attendees said: “this arts event is their primary purpose for their trip.”

19
Delaware Attendees Spent $29.80 Per Person, Per Event

20
Will You Travel for a Cultural Experience? Q: If this event were not happening, would you have traveled to another community to attend a similar cultural experience? 30.8% 27.0% 29.6% 27.7% 20.6% 25.4% 41.5% 52.3% 45.0% (National results)
.")
21
Arts Volunteerism in Delaware 13,270 volunteers donated 596,036 hours in 2010 ($12.7 million value) Average organization: 44.9 volunteers who donated 152.5 hours each Value of 2010 volunteer hour = $21.36
 Average organization: 44.9 volunteers who donated hours each Value of 2010 volunteer hour = $21.36")
22
Personal Arts Creativity Experiences Q: Do you actively participate in the creation of art (e.g., sing in a choir, act in a play, paint or draw)?
")
28
Arts & Economic Prosperity IV 6 Take-Aways for Delaware 1.$142.3 million industry 2.Supports 3,868 jobs (among top 10 DE employers) 3.Generates $9.9 million in local/state revenue 4.Attendees spend $29.80 per person (beyond admission) 5.Resilient in tough economic times 6.If arts aren’t available here, patrons will go elsewhere
 3.Generates $9.9 million in local/state revenue 4.Attendees spend $29.80 per person (beyond admission) 5.Resilient in tough economic times 6.If arts aren’t available here, patrons will go elsewhere")
29
National AEP4 Research Partners

30
The Arts Mean Business! www.AmericansForTheArts.org/EconomicImpact

Similar presentations


 Tampa, Florida October 25, 2011 Randy Cohen Americans for the Arts.>")


