Download presentation
Presentation is loading. Please wait.

1
Chapter 2 Functions and Linear Equations

2
Functions vs. Relations A "relation" is just a relationship between sets of information. A “function” is a well-behaved relation, that is, given a starting point we know exactly where to go.

3
Relations A relation is a mapping, or pairing, of input values with output values. The set of input values is called the domain. The set of output values is called the range. A relation as a function provided there is exactly one output for each input. It is NOT a function if at least one input has more than one output

4
Input Output -3 3 1-2 4 1 4 Identify the Domain and Range. Then tell if the relation is a function. Domain = {-3, 1,4} Range = {3,-2,1,4} Function? No: input 1 is mapped onto Both -2 & 1 Notice the set notation!!!

5
Identify the Domain and Range. Then tell if the relation is a function. Input Output -3 3 1 3 -2 4 Domain = {-3, 1,3,4} Range = {3,1,-2} Function? Yes: each input is mapped onto exactly one output

6
Conclusion and Definition Not every relation is a function. Every function is a relation. Definition: Let X and Y be two nonempty sets. A function from X into Y is a relation that associates with each element of X exactly one element of Y.

7
Representations of Functions Verbally Numerically, i.e. by a table Visually, i.e. by a graph Algebraically, i.e. by an explicit formula

8
Variable x is called independent variable Variable y is called dependent variable For convenience, we use f(x) instead of y. The ordered pair in new notation becomes: (x, y) = (x, f(x)) Y=f(x) x (x, f(x))
 = (x, f(x)) Y=f(x) x (x, f(x)).")
9
Domain and Range Suppose, we are given a function from X into Y. Recall, for each element x in X there is exactly one corresponding element y=f(x) in Y. This element y=f(x) in Y we call the image of x. The domain of a function is the set X. That is a collection of all possible x-values. The range of a function is the set of all images as x varies throughout the domain.
 in Y. This element y=f(x) in Y we call the image of x. The domain of a function is the set X. That is a collection of all possible x-values. The range of a function is the set of all images as x varies throughout the domain..")
10
Graphing Relations To graph the relation in the previous example: Write as ordered pairs (-3,3), (1,-2), (1,1), (4,4) Plot the points
, (1,-2), (1,1), (4,4) Plot the points")
11
A set of points in the xy-plane is the graph of a function if and only if every vertical line intersects the graph in at most one point. Vertical-Line Test

12
(-3,3) (4,4) (1,1) (1,-2)
 (4,4) (1,1) (1,-2)")
13
(-3,3) (4,4) (1,1) (1,-2) Use the vertical line test to visually check if the relation is a function. Function? No, Two points are on The same vertical line.

14
Same with the points (-3,3), (1,1), (3,1), (4,-2)
, (1,1), (3,1), (4,-2)")
15
(-3,3) (4,-2) (1,1) (3,1)
 (4,-2) (1,1) (3,1)")
16
(-3,3) (4,-2) (1,1) (3,1) Use the vertical line test to visually check if the relation is a function. Function? Yes, no two points are on the same vertical line

17
Graphing and Evaluating Functions Many functions can be represented by an equation in 2 variables: y=2x-7 An ordered pair is a solution if the equation is true when the values of x & y are substituted into the equation. Ex: (2,-3) is a solution of y=2x-7 because: -3 = 2(2) – 7 -3 = 4 – 7 -3 = -3
 is a solution of y=2x-7 because: -3 = 2(2) – 7 -3 = 4 – 7 -3 = -3.")
18
GRAPHING LINES BY MAKING A TABLE OR USING THE SLOPE-INTERCEPT FORM I could refer to the table method by input-output table or x-y table. For now I want you to include three values in your table. A negative number, zero, and a positive number. Graph y = 3x + 2 INPUT (X)OUTPUT (Y) -2-4 02 15 By making a table it gives me three points, in this case (-2, -4) (0, 2) and (1, 5) to plot and draw the line. See the graph.
OUTPUT (Y) By making a table it gives me three points, in this case (-2, -4) (0, 2) and (1, 5) to plot and draw the line. See the graph..")
19
Plot (-2, -4), (0, 2) and (1, 5) Then draw the line. Make sure your line covers the graph and has arrows on both ends. Be sure to use a ruler. Slope-intercept graphing Graph y = 3x + 2

20
More Examples Consider the following relation: Is this a function? What is domain and range?

21
Visualizing domain of

22
Visualizing range of

23
Domain = [0, ∞)Range = [0, ∞)
Range = [0, ∞)")
24
Graphing and Evaluating Functions Many functions can be represented by an equation in 2 variables: y=2x-7 An ordered pair is a solution if the equation is true when the values of x & y are substituted into the equation. Ex: (2,-3) is a solution of y=2x-7 because: -3 = 2(2) – 7 -3 = 4 – 7 -3 = -3
 is a solution of y=2x-7 because: -3 = 2(2) – 7 -3 = 4 – 7 -3 = -3.")
25
Slope is the steepness of a line. It can also be defined as rise over run (vertical change over horizontal change). Example Given the ordered pairs (-2, -2) and (4, 1), find the slope of the line that passes through these points.
. Example Given the ordered pairs (-2, -2) and (4, 1), find the slope of the line that passes through these points..")
26
Determine the slope of the line. rise/run = 3/6 = 1/2 6 3 Graph the points (-2, -2) and (4, 1) and apply “rise over run”.
 and (4, 1) and apply rise over run ..")
27
Types of Slope Positive Negative Zero Undefined or No Slope

28
Slope is sometimes referred to as the “rate of change” between 2 points.

29
The letter “m” is used to represent slope. Why?

30
If given 2 points on a line, you may find the slope using the formula m = y 2 – y 1 x 2 – x 1

31
The formula may sometimes be written as m =∆y. ∆x What is ∆ ?

32
Find the slope of the line through the points (3,7) and (5, 19). x1x1 y1y1 x2x2 y2y2 m = 19 – 7 5 – 3 m = 12 2 m = 6

33
(3, 4) and (-6, -2) m = -2 – 4 -6 – 3 m = -6 -9 m = ⅔
 and (-6, -2) m = -2 – 4 -6 – 3 m = m = ⅔")
34
What if the numerator is 0? What if the denominator is 0?

35
Parallel Lines Parallel Lines - coplanar lines that never intersect What is the slope of the red line? 1/2 What is the slope of the blue line? 1/2 Parallel Lines have the slope! same

36
Perpendicular Lines Perpendicular Lines – lines that intersect to form right angles What is the slope of the red line? -1/4 What is the slope of the blue line? 4/1 Perpendicular Lines have slopes! negative reciprocal

37
Checking for Parallel Lines Are lines ℓ 1 and ℓ 2 parallel? Explain.

38
Checking for Parallel Lines Find the slope of each line. NOT PARALLEL!!!!!!

39
Checking for Perpendicular Lines Lines ℓ 1 and ℓ 2 are neither horizontal nor vertical. Are they perpendicular? Explain.

40
Checking for Perpendicular Lines Find the slope of each line. Perpendicular. The slopes have a product of -1.

41
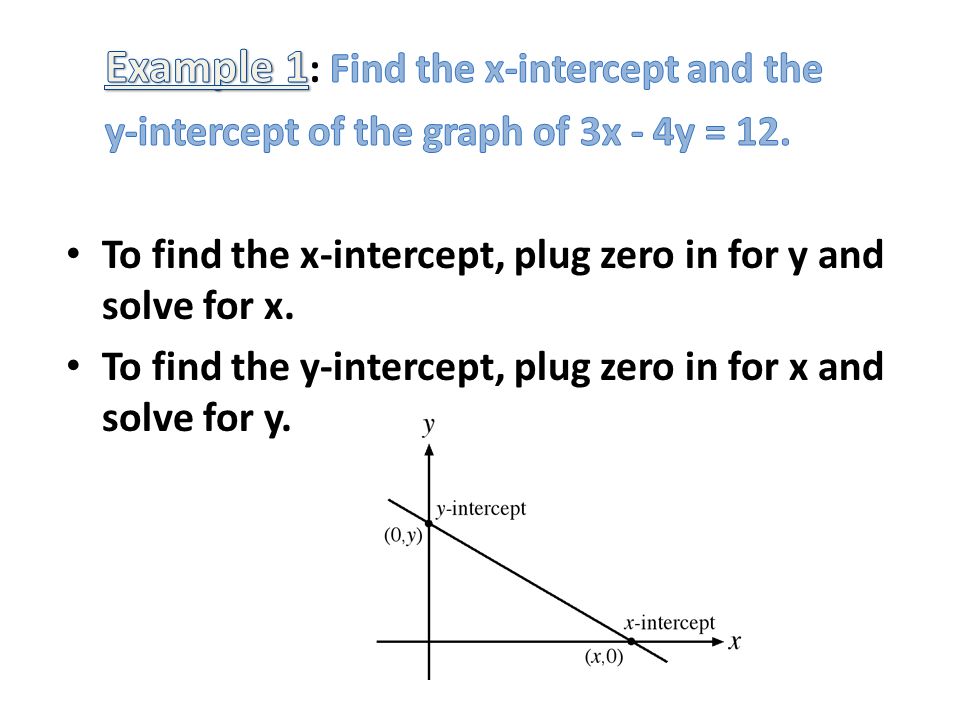
X AND Y INTERCEPTS The x-intercept is the x-coordinate of a point where the graph crosses the x-axis. The y-intercept is the y-coordinate of a point where the graph crosses the y-axis. The x-intercept would be 4 and is located at the point (4, 0). The y-intercept is 3 and is located at the point (0, 3).
. The y-intercept is 3 and is located at the point (0, 3)..")
42
SLOPE-INTERCEPT FORM OF A LINE The slope intercept form of a line is y = mx + b, where “m” represents the slope of the line and “b” represents the y-intercept. When an equation is in slope-intercept form the “y” is always on one side by itself. It can not be more than one y either. If a line is not in slope-intercept form, then we must solve for “y” to get it there. Examples

43
IN SLOPE-INTERCEPTNOT IN SLOPE-INTERCEPT y = 3x – 5y – x = 10 y = -2x + 102y – 8 = 6x y = -0.5x – 2y + 4 = 2x Put y – x = 10 into slope-intercept form Add x to both sides and would get y = x + 10 Put 2y – 8 = 6x into slope-intercept form. Add 8 to both sides then divide by 2 and would get y = 3x + 4 Put y + 4 = 2x into slope-intercept form. Subtract 4 from both sides and would get y = 2x – 4.

44
Steps if given the slope and a point on the line. 1.Substitute the slope into the equation form m. 2.Substitute the y – int. into the equation for b. 3.Rewrite equation. 1.y = mx + b 2.Slope is -2. 3.y = -2x + b 4.b = 7 5.y = -2x + 7 Find the equation of the line with slope of -2 and y intercept of 7 i.e.(0,7).
..")
45
FIND EQUATION OF A LINE GIVEN 2 POINTS 1.Find the slope between the two points. 2.Plug in the slope in the slope- intercept form. 3.Pick one of the given points and plug in numbers for x and y. 4.Solve and find b. 5.Rewrite final form. Find the equation of the line between (2, 5) and (-2, -3). 1.(-3 – 5) / (-2 – 2) = -8/-4 = 2/1 Slope is 2. 2.y = 2x + b 3.Picked (2, 5) so (5) = 2(2) + b 4.5 = 4 + ?b? 5.b = 1 6.y = 2x + 1 Two other ways
 and (-2, -3). 1.(-3 – 5) / (-2 – 2) = -8/-4 = 2/1 Slope is 2. 2.y = 2x + b 3.Picked (2, 5) so (5) = 2(2) + b 4.5 = 4 + b. 5.b = 1 6.y = 2x + 1 Two other ways.")
46
FIND EQUATION OF A LINE GIVEN SLOPE AND ANY POINT 1.Plug in the slope in the point-slope form. 2.Plug in coordinate numbers for x1 and y1. 3.Use the distributive property. 4.Solve for y and rewrite final form. Find the equation of the line between (2, 5) with a slope of -1/2 1.(y – y1) = m (x – x1) = (y – y1) = -1/2 (x – x1) Slope is -1/2. 2.(y – 5) = -1/2 (x – 2) 3.y – 5 = -1/2x + 1 4.y = -1/2x + 6 Two other ways
 with a slope of -1/2 1.(y – y1) = m (x – x1) = (y – y1) = -1/2 (x – x1) Slope is -1/2. 2.(y – 5) = -1/2 (x – 2) 3.y – 5 = -1/2x y = -1/2x + 6 Two other ways.")
47
GRAPHING LINES BY MAKING A TABLE OR USING THE SLOPE-INTERCEPT FORM I could refer to the table method by input-output table or x-y table. For now I want you to include three values in your table. A negative number, zero, and a positive number. Graph y = 3x + 2 INPUT (X)OUTPUT (Y) -2-4 02 15 By making a table it gives me three points, in this case (-2, -4) (0, 2) and (1, 5) to plot and draw the line. See the graph.
OUTPUT (Y) By making a table it gives me three points, in this case (-2, -4) (0, 2) and (1, 5) to plot and draw the line. See the graph..")
48
Plot (-2, -4), (0, 2) and (1, 5) Then draw the line. Make sure your line covers the graph and has arrows on both ends. Be sure to use a ruler. Slope-intercept graphing Graph y = 3x + 2

49
Slope-intercept graphing Steps 1.Make sure the equation is in slope-intercept form. 2.Identify the slope and y-intercept. 3.Plot the y-intercept. 4.From the y-intercept use the slope to get another point to draw the line. 1.y = 3x + 2 2.Slope = 3 (note that this means the fraction or rise over run could be (3/1) or (-3/-1). The y-intercept is 2. 3.Plot (0, 2) 4.From the y-intercept, we are going rise 3 and run 1 since the slope was 3/1.
 or (-3/-1). The y-intercept is 2. 3.Plot (0, 2) 4.From the y-intercept, we are going rise 3 and run 1 since the slope was 3/1..")
50
FIND EQUATION OF A LINE GIVEN 2 POINTS 1.Find the slope between the two points. 2.Plug in the slope in the slope- intercept form. 3.Pick one of the given points and plug in numbers for x and y. 4.Solve and find b. 5.Rewrite final form. Find the equation of the line between (2, 5) and (-2, -3). 1.Slope is 2. 2.y = 2x + b 3.Picked (2, 5) so (5) = 2(2) + b 4.5 = 4 + ?b? 5.b = 1 6.y = 2x + 1 Two other ways
 and (-2, -3). 1.Slope is 2. 2.y = 2x + b 3.Picked (2, 5) so (5) = 2(2) + b 4.5 = 4 + b. 5.b = 1 6.y = 2x + 1 Two other ways.")
51
Steps if given the slope and a point on the line. 1.Substitute the slope into the slope-intercept form. 2.Use the point to plug in for x and y. 3.Find b. 4.Rewrite equation. If given a graph there are three ways. One way is to find two points on the line and use the first method we talked about. Another would be to find the slope and pick a point and use the second method. The third method would be to find the slope and y-intercept and plug it directly into y = mx + b.

52
Graph in Standard Form: Steps: 1. Find the x- and y- intercepts 2. Graph x-intercept on x-axis ( ) 3. Graph y-intercept on y-axis ( ) 4. Connect the dots
 3. Graph y-intercept on y-axis ( ) 4. Connect the dots.")
53
The x-intercept of a graph is the point where the graph crosses the x-axis. The y-intercept of a graph is the point where the graph crosses the y-axis.

54
y - intercept x - intercept y X (2,0) (0,-1)
 (0,-1)")
55
Vocabulary – BIG CONCEPT x-intercept - the coordinate of a point where the graph crosses the x-axis. (Important – this is when y = 0) y-intercept - the coordinate of a point where the graph crosses the y-axis (when x = 0). x - intercept y - intercept
 y-intercept - the coordinate of a point where the graph crosses the y-axis (when x = 0). x - intercept y - intercept.")
56
EXAMPLES OF X-INTERCEPTS EXAMPLES OF Y-INTERCEPTS (-2,0) (-1,0) (4,0) (0,0) (1.8,0) (-256,0) (0,-44) (0,19) (0,5) (0,0) REMEMBER Y = 0 REMEMBER X = 0
 (-1,0) (4,0) (0,0) (1.8,0) (-256,0) (0,-44) (0,19) (0,5) (0,0) REMEMBER Y = 0 REMEMBER X = 0")
58
(4,0) (0,-3) Make a small t-chart 4040 0 -3 x y
 (0,-3) Make a small t-chart x y")
59
So when is it a good idea to use x and y intercepts to graph??? When the two coefficients go into the constant!! 2x + 3y = 6 -3x – 4y = 24 12x + 5y = 60 5x – 4y = 40

60
Find the x and y-intercepts. Plot the x and y-intercepts and draw a line through them connecting them with a straight edge. 4x + 8y =24 x-intercept y-intercept 4x + 8(0) = 24 4(0) + 8y = 24 4x = 248y = 24 (6,0) (0,3)
 = 24 4(0) + 8y = 24 4x = 248y = 24 (6,0) (0,3).")
61
(6,0) (0,3) 4x + 8y =24
 (0,3) 4x + 8y =24")
63
Graph 4x + 3y = 12 using intercepts Find x-intercept 4x + 3(0) = 12 Find y-intercept 4(0) + 3y = 12 4x = 12 x = 3 3y = 12 y = 4
 = 12 Find y-intercept 4(0) + 3y = 12 4x = 12 x = 3 3y = 12 y = 4")
64
Graph 2x + 3y = 12 using intercepts xy 0 0 6

65
Graph 3x + 5y = 15 using intercepts xy 0 0 5 DO YOU THINK THESE LINES INTERSECT???

66
Graph 5x - 2y = 10 using intercepts xy 0 0 2

67
Graph 2y = 3x - 6 using intercepts xy 0 0 2 -3x + 2y = -6 Put into Standard form first: Ax + By = C

68
Graph 4y = 16 using 3-points xy 0 3 6 4 y = 4

69
Graph 3x = 18 using 3-points xy 0 3 - 4 x = 6

70
Graph in Standard Form: Steps: 1. Find the x- and y- intercepts 2. Graph x-intercept on x-axis ( ) 3. Graph y-intercept on y-axis ( ) 4. Connect the dots
 3. Graph y-intercept on y-axis ( ) 4. Connect the dots.")
71
Example 1 4x – 6y = 12 Y - intercept: 4(0) – 6y = 12 0 – 6y = 12 -6y = 12 y = -2 (0,-2) X – intercept: 4x – 6(0) = 12 4x – 0 = 12 4x = 12 x = 3 (3,0) Graph on y-axisGraph on x-axis
 – 6y = 12 0 – 6y = 12 -6y = 12 y = -2 (0,-2) X – intercept: 4x – 6(0) = 12 4x – 0 = 12 4x = 12 x = 3 (3,0) Graph on y-axisGraph on x-axis")
72
Example 2 2x + 4y = -6 Y - intercept: 2(0) + 4y = -6 0 + 4y = -6 4y = -6 y = -3/2 (0,-3/2) X – intercept: 2x + 4(0) = -6 2x – 0 = -6 2x = -6 x = -3 (-3,0)
 + 4y = y = -6 4y = -6 y = -3/2 (0,-3/2) X – intercept: 2x + 4(0) = -6 2x – 0 = -6 2x = -6 x = -3 (-3,0)")
73
Find the x and y intercepts of 4x + 3y = 12 To find the x - intercept: 1. Write the original equation. 4x + 3y = 12 2. 4x + 3(0) = 12 Substitute 0 for y 3. 4x = 12 Solve for x 4. x = 3 Simplify To find the y - intercept: 1.Write the original equation. 4x + 3y = 12 2.4(0) + 3y = 12 Substitute 0 for x 3.3y = 12 Solve for y 4.y = 4 Simplify The intercepts are at the points (3, 0) and (0,4)
 = 12 Substitute 0 for y 3. 4x = 12 Solve for x 4. x = 3 Simplify To find the y - intercept: 1.Write the original equation. 4x + 3y = (0) + 3y = 12 Substitute 0 for x 3.3y = 12 Solve for y 4.y = 4 Simplify The intercepts are at the points (3, 0) and (0,4).")
74
Using intercepts, graph the line x – 2 = 4y Hint: Find the x and y intercepts – then connect the dots. Remember – 2 points determine a line!

75
Quick Review An x-intercept is the ______ coordinate of a point where a graph crosses the ____ axis. At the x-intercept, the value of y is _____. A y-intercept is the ______ coordinate of a point where a graph crosses the ____ axis. At the y-intercept, the value of x is ______. To graph a line using the intercepts you need to……. How many ways do you know how to graph NOW?

Similar presentations