Download presentation
Presentation is loading. Please wait.

1
5 The Stock Market

2
Take stock in yourself. Make sure you have a good understanding of:
Learning Objectives Take stock in yourself. Make sure you have a good understanding of: The difference between primary and secondary stock markets. The workings of the New York Stock Exchange. How NASDAQ operates. How to calculate index returns. How to read and understand the stock market information reported in the financial press.

3
Venture capital, Private Equity financing

4
Financing Options: From Young, Start-Ups to Matured Firms
Venture Capital Private Equity Bank Loans Other Personal Sources Matured Firms Public Bonds Stock Offerings All others including what young, start-ups can have

5
Private Equity and Venture Capital
Private Equity is the used for the rapidly growing area of equity financing for nonpublic companies. PEs are investment companies set up as limited partnerships that pool money from investors and then invest the money on behalf them. Private equity provides more common “seed money” for start-up companies because banks are generally not interested in making loans to start-up companies, especially ones: with no assets (other than an idea) run by fledgling entrepreneurs with no track record. Firms with this profile search for venture capital (VC), an important part of the private equity markets. Firms other than start-ups might also need financing. Private equity also includes: middle-market firms large leveraged buyouts PE firms are paid “2/20” fee structure (i.e., a 2% annual management fee and 20% of profits.)
 run by fledgling entrepreneurs with no track record. Firms with this profile search for venture capital (VC), an important part of the private equity markets. Firms other than start-ups might also need financing. Private equity also includes: middle-market firms. large leveraged buyouts. PE firms are paid 2/20 fee structure (i.e., a 2% annual management fee and 20% of profits.)")
6
The Structure of Private Equity Funds
Private equity funds and hedge funds are two types of investment companies. Both are set up as limited partnerships. pool money from investors. invest this money on behalf of these investors. use, typically, a 2/20 fee structure (i.e., a 2 percent annual management fee and 20 percent of profits). have built-in constraints to prevent managers from taking excessive compensation. Private equity funds generally have: a high-water-mark provision a “clawback” provision
. have built-in constraints to prevent managers from taking excessive compensation. Private equity funds generally have: a high-water-mark provision. a clawback provision.")
7
Venture Capital, I Venture Capital refers to financing new, often high-risk, start-ups. Individual venture capitalists invest their own money , but more likely Venture capital firms pool funds from various sources, like Individuals Pension funds Insurance companies Large corporations University endowments Venture capitalists know that many new companies will fail, but the companies that succeed can provide enormous profits. PE firms are paid “2/20” fee structure (i.e., a 2% annual management fee and 20% of profits.)
")
8
Venture Capital, II To limit their risk:
Venture capitalists generally provide financing in stages. Venture capitalists actively help run the company. At each stage, enough money is invested to reach the next stage. Ground-floor financing (or seed money) Mezzanine Level financing At each stage of financing, the value of the founder’s stake grows and the probability of success rises. If goals are not met, the venture capitalists withhold further financing. If a start-up succeeds: The big payoff frequently comes when the company is sold to another company or goes public. Either way, investment bankers are often involved in the process.
 Mezzanine Level financing. At each stage of financing, the value of the founder’s stake grows and the probability of success rises. If goals are not met, the venture capitalists withhold further financing. If a start-up succeeds: The big payoff frequently comes when the company is sold to another company or goes public. Either way, investment bankers are often involved in the process.")
9
Google - History The first funding for Google as a company was secured on August 1998 in the form of a $100,000 contribution from Andy Bechtolsheim, co-founder of Sun Microsystems, given to a corporation which did not yet exist. On June 7, 1999, a round of equity funding totaling $25 million was given by rival venture capital firms Kleiner Perkins Caufield & Byers and Sequoia Capital. In January 2004, Google announced the hiring of Morgan Stanley and Goldman Sachs Group to arrange an IPO. Google's IPO took place on August 19, A total of 19,605,052 shares were offered at a price of $85 per share. Of that, 14,142,135 were floated by Google and 5,462,917 by selling stockholders. The sale raised US$1.67 billion, and gave Google a market capitalization of more than $23 billion. The vast majority of Google's 271 million shares remained under Google's control. Many of Google's employees became instant paper millionaires.

10
Types of Private Equity Funds: Middle Market
Many small, regional private equity funds concentrate their investments in “middle market” companies. ongoing concerns (i.e., not start-ups) known performance history typically, small and family owned and operated. Reasons middle market companies seek more capital Expansion beyond their existing region Founder wants to “cash out” A private equity fund might purchase a portion of the business so that others can now manage the company.
 known performance history. typically, small and family owned and operated. Reasons middle market companies seek more capital. Expansion beyond their existing region. Founder wants to cash out A private equity fund might purchase a portion of the business so that others can now manage the company.")
11
Types of Private Equity Funds: Leveraged Buyouts
Suppose a company (or someone else) purchases all the shares of the company held by the public at large? This process is called “taking the company private.” The cost of going private is often high. A manager or investor who wants to take a company private probably needs to borrow a significant amount of money. Taking a company private is called a leveraged buyout (LBO). LBO market activity levels depend on credit markets. Around 2005, the LBO market was quite active. Activity in the LBO market came to a standstill after the crash of 2008.
 purchases all the shares of the company held by the public at large This process is called taking the company private. The cost of going private is often high. A manager or investor who wants to take a company private probably needs to borrow a significant amount of money. Taking a company private is called a leveraged buyout (LBO). LBO market activity levels depend on credit markets. Around 2005, the LBO market was quite active. Activity in the LBO market came to a standstill after the crash of")
12
Selling securities to the public

13
Selling Securities to the Public
The primary market is the market where investors purchase newly issued securities. Initial public offering (IPO): An IPO occurs when a company offers stock for sale to the public for the first time. Seasoned equity offering (SEO): If a company already has public shares, an SEO occurs when a company raises more equity. The secondary market is the market where investors trade previously issued securities. An investor can trade: Directly with other investors. Indirectly through a broker who arranges transactions for others. Directly with a dealer who buys and sells securities from inventory. Primary Market: “New-car with sticker still in window”; Secondary Market: “Used car market”
: An IPO occurs when a company offers stock for sale to the public for the first time. Seasoned equity offering (SEO): If a company already has public shares, an SEO occurs when a company raises more equity. The secondary market is the market where investors trade previously issued securities. An investor can trade: Directly with other investors. Indirectly through a broker who arranges transactions for others. Directly with a dealer who buys and sells securities from inventory. Primary Market: New-car with sticker still in window ; Secondary Market: Used car market")
14
The Primary Market for Common Stock
An IPO (and an SEO) involves several steps. Company appoints investment banking firm (or, underwrites) to arrange financing. Investment banker designs the stock issue and arranges for fixed commitment or best effort underwriting. Company prepares a prospectus (usually with outside help) and submits it to the Securities and Exchange Commission (SEC) for approval. Investment banker circulates preliminary prospectus (red herring). Prospectus : registration statement describing the issue and the issuer red herring : preliminary prospectus available during the waiting period Launch a road show: series of presentations to potential investors Upon obtaining SEC approval, company finalizes prospectus. Underwriters place announcements (tombstones) in newspapers and begin selling shares.
 involves several steps. Company appoints investment banking firm (or, underwrites) to arrange financing. Investment banker designs the stock issue and arranges for fixed commitment or best effort underwriting. Company prepares a prospectus (usually with outside help) and submits it to the Securities and Exchange Commission (SEC) for approval. Investment banker circulates preliminary prospectus (red herring). Prospectus : registration statement describing the issue and the issuer. red herring : preliminary prospectus available during the waiting period. Launch a road show: series of presentations to potential investors. Upon obtaining SEC approval, company finalizes prospectus. Underwriters place announcements (tombstones) in newspapers and begin selling shares.")
15
The Investment Banker’s Role
Underwriting the Issue: purchases the security at agreed-on price and bears the risk of reselling it to the public Underwriting Syndicate: group formed by investment banker to share the financial risk of underwriting Selling Group: other brokerage firms that help the underwriting syndicate sell issue to the public Investment Banker Compensation: typically in the form of a discount on the sale price of the securities Underwriter Spread is the profit made by the underwriters. It is equal to the difference between the price the underwriters pay the issuer for the securities and the price the underwriters receive from the resale of those securities to investors.

16
The Selling Process for a Large Security Issue

17
IPO Tombstone

18
Example: Underwriter Spread
Source: IPO Prospectus

19
Annual IPO Data, 1999–2008 One Extreme Case: VA Linux, the IPO Offering Price at $30 and closed on the first day of trading at $239.25, a 698% one-day return!

20
Bid vs. ask prices

21
Bid and Ask Prices The bid price: The ask price:
Bidders are offers to buy. The price dealers pay investors. The price investors receive from dealers. Investors “sell to the bid.” The ask price: Asked prices are offers to sell. The price dealers receive from investors. The price investors pay dealers. The difference between the bid and ask prices is called the bid-ask spread, or simply spread.

22
Display Book

23
Secondary Market: NYSE- Specialists
Bid Ask GE $ $28.75 Specialist buys low, sells high Specialists buys at $28.25, so you sell at $28.25. Specialist sells at $28.75, so you buy at $28.75 $ $28.25 = $0.50 = “spread”

24
Secondary Market: NASDAQ
Suppose three dealers posts their best quotes for DELL Computers. Joe Bob Jennifer Bid Ask Bid Ask Bid Ask NASDAQ reports: Bid Ask

25
Types of orders

26
Stock Market Order Types

27
Two Most Common Orders Market orders: Limit orders:
You specify ticker and quantity Immediate execution at best available price Market buy will be executed at lowest ask Market sell will be executed at highest bid Limit orders: You specify ticker, quantity, and price The order will be executed only if trade can be made at the limit price or better Limit Buy can only be executed at limit price or lower Limit Sell can only be executed at limit price or higher

28
Two Most Common Orders Market Orders Limit Orders
Orders to buy or sell stock at best price available when order is placed for immediate execution Fastest way to fill order The potential drawback is that an investor buy or sell shares at sub-optimal prices. Limit Orders An order placed with a brokerage to buy or sell a set number of shares at a specified price or better. If price limits are not met, order is not filled. Buy limit order: Order to buy at or below a specified price. Specify the maximum price. Sell limit order: Sell at or above a specified price. Specify the minimum price. Beneficial to an investor betting on a highly volatile stock. Why? The potential drawback to the investor is that an unfavorable price movements will result in non-executed orders. This could mean “missing out” an opportunity to gain.

29
Example: Market Order vs. Limit Order
Suppose the current market price is $364 Buy 100 shares at market order Buy 100 shares at limit $354 Buy 100 shares at limit $355 Buy 100 shares at stop $365

30
Example: Limit Order Suppose we want to buy 10 shares of AAPL that are currently sold at $700 per share today. A market today is a particularly volatile day because of several macro economic indicators are about to come out. A trading range for the first few hours are somewhere between $690 and $710. You submit a limit order at $690 for 10 shares. During the specified periods (1-day, 3-days, or 30days, etc), if the price drops to $690, your limit order will be triggered (or become active), and executed at $690. This is a good scenario. However, if the price never drops to $690 or below and it keeps rising (perhaps due to a favorable news on AAPL), your order will not be executed, and you miss out an opportunity to profit.
, if the price drops to $690, your limit order will be triggered (or become active), and executed at $690. This is a good scenario. However, if the price never drops to $690 or below and it keeps rising (perhaps due to a favorable news on AAPL), your order will not be executed, and you miss out an opportunity to profit.")
31
Stop Orders Fill-or-Kill Orders Day Orders
Also referred to as a stop-loss order, is an order to buy or sell a stock once the price of the stock reaches a specified price, known as the stop price. When the stop price is reached, a stop order becomes a market order. Also known as a “stop-loss.” Stop order (to Sell): Convert to a market order to sell when the stock price crosses the stop price from above. Typically used to protect investors from stock price declines Can be used to limit a loss or to protect a profit on a stock that they own. Stop order (to Buy): Convert to a market order to buy when the stock price crosses the stop price form below. Typically used to protect investors from stock price rises Can be used to limit a loss or to protect a profit on a stock that they have sold short. Fill-or-Kill Orders Limit orders which is canceled if not filled immediately Day Orders Limit orders that expires at end of the day if not filled Good-’til-Canceled (GTC) Orders Limit orders that remains in effect for typically six months unless filled, canceled, or renewed Other terminologies Odd-lot Orders : Orders for less than 100 shares of stock Round-lot Orders: Orders for a 100-share unit or multiples thereof
: Convert to a market order to sell when the stock price crosses the stop price from above. Typically used to protect investors from stock price declines. Can be used to limit a loss or to protect a profit on a stock that they own. Stop order (to Buy): Convert to a market order to buy when the stock price crosses the stop price form below. Typically used to protect investors from stock price rises. Can be used to limit a loss or to protect a profit on a stock that they have sold short. Fill-or-Kill Orders. Limit orders which is canceled if not filled immediately. Day Orders. Limit orders that expires at end of the day if not filled. Good-’til-Canceled (GTC) Orders. Limit orders that remains in effect for typically six months unless filled, canceled, or renewed. Other terminologies. Odd-lot Orders : Orders for less than 100 shares of stock. Round-lot Orders: Orders for a 100-share unit or multiples thereof.")
32
Stop Orders Stop Orders are Intended to prevent something bad from happening (like losing a lot of money). Sell Stop (or stop loss) Use this order when you have a long position and want to protect yourself from a price decline. The Stop price will be below the current price of the stock. The Stop price is the trigger or activation point. If the stop price is reached or passed (the price goes lower), the order becomes a market order to be executed at the best available price (which may be higher or lower than stop price). Risk: price suddenly plummets and your position is liquidated at a large loss. Buy Stop Use this order when you have a short position and want to protect yourself if the stock price rises. The Stop price will be above the current price of the stock. The Stop is the trigger or activation point. If the stop price is reached or passed (goes higher), the order becomes a market order to be executed at the best available price (which may be higher or lower than stop price). Risk: price suddenly rockets and you buy at a higher price than your buy stop.
 Use this order when you have a long position and want to protect yourself from a price decline. The Stop price will be below the current price of the stock. The Stop price is the trigger or activation point. If the stop price is reached or passed (the price goes lower), the order becomes a market order to be executed at the best available price (which may be higher or lower than stop price). Risk: price suddenly plummets and your position is liquidated at a large loss. Buy Stop. Use this order when you have a short position and want to protect yourself if the stock price rises. The Stop price will be above the current price of the stock. The Stop is the trigger or activation point. If the stop price is reached or passed (goes higher), the order becomes a market order to be executed at the best available price (which may be higher or lower than stop price). Risk: price suddenly rockets and you buy at a higher price than your buy stop.")
33
Limit Order vs. Stop Order
Suppose you own AAPL shares that has been hovering around $700 per share. You can put a stop order to sell at $680. If the price crosses 680 from above, the stop order becomes a market order. You say “Price is more likely to decline, but I am not sure.” Your goal is to limit a loss or protect profit. Your attitude is pessimistic. Since once it get triggered and becomes a market order, there will be no guarantee that you will get shares at $680. You can also put a limit order to sell at $710. If the price crosses 710 from below, your shares will be sold at 710 or better price. You say, “Price is more likely to rise, but I am not sure.” Your goal is to profit a little more with volatile price movements . Your attitude is optimistic.

34
Practices on Ordering Want to buy AAPL, but you think that it will temporarily fall and bounce back Limit to buy Want to buy AAPL, but you fear that it may rise continuously Stop to buy Already own AAPL but you think it temporarily rise and fall back Limit to sell Already own AAPL but you fear it may drop continuously Stop to sell or stop-limit to sell Did short sale on AAPL, but you fear it may rise continuously Stop to buy

35
Stock-Limit Orders Stop-Limit Orders
Convert to a limit order to buy (sell) when the stock price crosses the stop price from below (above) Orders to sell stock at or better than specified price (limit price) Therefore, there are two prices to specify: a stop price (a “trigger” price) and a desired price (limit price) Prevents sales at undesirable price No sale may occur if prices continues to decline Example: Suppose you own AAPL shares but want to dump now. You put stop ($680) and limit ($660). Once the price reaches to $680, it will become a limit order. What if you put a stop order only? Then, shares can be sold at any prices like $500, if a negative rumor (like accounting fraud) comes out and no one wants to buy at $500 or above. However, if the rumor turns out to be a false alarm, the price may bounce back to $660.
 when the stock price crosses the stop price from below (above) Orders to sell stock at or better than specified price (limit price) Therefore, there are two prices to specify: a stop price (a trigger price) and a desired price (limit price) Prevents sales at undesirable price. No sale may occur if prices continues to decline. Example: Suppose you own AAPL shares but want to dump now. You put stop ($680) and limit ($660). Once the price reaches to $680, it will become a limit order. What if you put a stop order only Then, shares can be sold at any prices like $500, if a negative rumor (like accounting fraud) comes out and no one wants to buy at $500 or above. However, if the rumor turns out to be a false alarm, the price may bounce back to $660.")
36
Stop Limit Orders Sell Stop Limit Buy Stop Limit
Intended to prevent something bad from happening (But, in an active market, the Limit can hurt you) Sell Stop Limit Use when you have a long position and want to protect yourself from a price decline. The Stop price will be below the current price of the stock. The Stop price is the trigger or activation point. The limit says you will not accept a selling price below the limit. Risk: The price plummets and you might not get out. Buy Stop Limit Use when you have a short position and want to protect yourself if the stock price rises. The Stop price will be above the current price of the stock. The Limit says you will not accept a purchase price above the limit. Risk: The price rockets and you might not get out.
 Sell Stop Limit. Use when you have a long position and want to protect yourself from a price decline. The Stop price will be below the current price of the stock. The Stop price is the trigger or activation point. The limit says you will not accept a selling price below the limit. Risk: The price plummets and you might not get out. Buy Stop Limit. Use when you have a short position and want to protect yourself if the stock price rises. The Stop price will be above the current price of the stock. The Limit says you will not accept a purchase price above the limit. Risk: The price rockets and you might not get out.")
37
Stop Orders versus Stop Limit Orders
Stop orders guarantee execution (if the stock reaches or moves past your stop price), but not the price. Stop limit orders guarantee price, but not execution. Stop and Limit prices do not have to be the same. You could use a stop of $45 with a limit of $44.
, but not the price. Stop limit orders guarantee price, but not execution. Stop and Limit prices do not have to be the same. You could use a stop of $45 with a limit of $44.")
38
Comparing Stop and Stop Limit Orders, I.

39
Comparing Stop and Stop Limit Orders, II.

40
Comparing Stop and Stop Limit Orders, III.

41
Trading on the Web

42
Example Kelly wants to sell 600 shares of DeLux stock at the going market price after the stock reaches $42 a share. Which type of order should she place? A. stop B. limit C. market D. fixed E. loss A

43
Example Which one of the following orders is frequently used as a means to limit losses resulting from a short sale? A. limit B. market C. day D. stop-sell E. stop-buy E

44
Example Marcus just placed a stop limit order to sell 100 shares at $21 stop, $18 limit. Which one of the following statements is correct concerning this order if the current market price is $16? A. As soon as the price rises to $18, the stock will be sold. B. The stock will sell for at least $18 but less than $21. C. The stock will sell for $18 a share as soon as the price hits $21. D. The order will become a limit order to sell at $21 once the market price reaches $18. E. The order will become a limit order to sell at $18 once the market price reaches $21. E

45
Stock exchanges - NYSE

46
Secondary Markets: Broker Markets and Dealer Markets
Broker Markets: consists of national and regional securities exchanges A broker brings buyers and sellers together but does not maintain an inventory. 60% of the total dollar volume of all shares in U.S. stock market trade here Trades are executed when a buyer and a seller are brought together by a broker and the trade takes place directly between the buyer and seller [and/or specialist (to be explained later)] However, specialists sometimes act as “exclusive” dealer. Dealer Markets: consists of both the Nasdaq market and the OTC market (i.e., trading networks) A dealer maintains an inventory and stands ready to buy and sell at any time. Trades are executed with a dealer (market maker) in the middle. Sellers sell to a market maker at a stated price. The market maker then offers the securities to a buyer.
] However, specialists sometimes act as exclusive dealer. Dealer Markets: consists of both the Nasdaq market and the OTC market (i.e., trading networks) A dealer maintains an inventory and stands ready to buy and sell at any time. Trades are executed with a dealer (market maker) in the middle. Sellers sell to a market maker at a stated price. The market maker then offers the securities to a buyer.")
47
Secondary Market: Broker and Dealer Markets

48
The Secondary Market for Common Stock
Most common stock trading is directed through an organized stock exchange or trading network. Whether a stock exchange or trading network, the goal is to match investors wishing to buy stocks with investors wishing to sell stocks.

49
Market Capitalization of Major World Stock Exchanges, 2007

50
The New York Stock Exchange
The New York Stock Exchange (NYSE), popularly known as the Big Board, celebrated its bicentennial in 1992. The NYSE has occupied its current building on Wall Street since the early 1900’s. For 200 years, the NYSE was a not-for-profit New York State corporation. Then, The NYSE went public in 2006 (NYSE Group, Inc., ticker: NYX) Naturally, NYX stock is listed on the NYSE In 2007, NYSE Group merged with Euronext to form NYSE Euronext, the world’s largest exchange.
, popularly known as the Big Board, celebrated its bicentennial in The NYSE has occupied its current building on Wall Street since the early 1900’s. For 200 years, the NYSE was a not-for-profit New York State corporation. Then, The NYSE went public in (NYSE Group, Inc., ticker: NYX) Naturally, NYX stock is listed on the NYSE. In 2007, NYSE Group merged with Euronext to form NYSE Euronext, the world’s largest exchange.")
51
NYSE Seats and Trading Licenses
Historically, the NYSE had 1,366 exchange members. These members: Were said to own “seats” on the exchange. Collectively owned the exchange, although professionals managed the exchange. Regularly bought and sold seats (Record seat price: $3 million in 2005) Seat holders could buy and sell securities on the exchange floor without paying commissions. In 2006, all of this changed when the NYSE went public. Merged with Archipelago Exchanges and later merged with Euronext. Instead of purchasing seats, exchange members purchase trading licenses: number limited to 1,500 In 2007, a license would set you back a cool $55,000—per year. Having a license entitles the holder to buy and sell securities on the floor of the exchange. However, over 99% of orders are processed electronically.
 Seat holders could buy and sell securities on the exchange floor without paying commissions. In 2006, all of this changed when the NYSE went public. Merged with Archipelago Exchanges and later merged with Euronext. Instead of purchasing seats, exchange members purchase trading licenses: number limited to 1,500. In 2007, a license would set you back a cool $55,000—per year. Having a license entitles the holder to buy and sell securities on the floor of the exchange. However, over 99% of orders are processed electronically.")
52
Super Display Book System (SDBK)
A substitute for floor brokers: the efficient Super Display Book system (SDBK) The SDBK has recently replaced the well-known SuperDOT system (the DOT stands for designated order turnaround). Based on the NYSE’s electronic trading engine, Arca, the NYSE SDBK is a server-based system. Trading via the SDBK is remarkably fast. NYSE customers can have their trades executed within 5 milliseconds (down from a relatively sluggish 350 milliseconds in 2007). How fast is this trading? For comparison, when Danica Patrick is running her Number 10 Stewart Haas Go Daddy Chevrolet at 200 miles per hour, she races only about 1.5 feet in 5 milliseconds.
 The SDBK has recently replaced the well-known SuperDOT system (the DOT stands for designated order turnaround). Based on the NYSE’s electronic trading engine, Arca, the NYSE SDBK is a server-based system. Trading via the SDBK is remarkably fast. NYSE customers can have their trades executed within 5 milliseconds (down from a relatively sluggish 350 milliseconds in 2007). How fast is this trading For comparison, when Danica Patrick is running her Number 10 Stewart Haas Go Daddy Chevrolet at 200 miles per hour, she races only about 1.5 feet in 5 milliseconds.")
53
NYSE-Listed Stocks The number of shareholders Trading activity
In 2008, the total number of companies listed on the NYSE represented a total global market value of about $16.7 trillion. Initial and annual listing fees are charged based on the number of shares. To apply for listing, companies have to meet certain minimum requirements with respect to: The number of shareholders Trading activity The number and value of shares held in public hands Annual earnings

54
Operation of the New York Stock Exchange
The fundamental business of the NYSE is to attract and process order flow. In 2010, the average trading volume on the NYSE was over 2 billion shares a day. Volume breakdown: About one-third from individual investors. Almost half from institutional investors. The remainder represents NYSE-member trading, mostly from specialists acting as market makers.

55
Circuit Breakers Sometimes the market wide order flow is such that regulators have deemed that a trading cease for a short time. These trading halts are call Circuit Breakers. All U.S. securities trading halts for 15 minutes when the S&P 500 falls 7% before 3:25 p.m. A plunge of 20% in the S&P 500 causes all trading to stop for the day. Be informed: The SEC is constantly tinkering with circuit breakers and what triggers them.

56
Stock exchanges - nasdaq

57
NASDAQ, I. The name “NASDAQ” is derived from the acronym NASDAQ, which stands for National Association of Securities Dealers Automated Quotations system. NASDAQ is now a proper name in its own right. Introduced in 1971, the NASDAQ market is a computer network of securities dealers who disseminate timely security price quotes to NASDAQ subscribers. No physical location Multiple market maker system The NASDAQ has more companies listed than the NYSE. On most days, volume on the NASDAQ exceeds the NYSE volume.

58
NASDAQ, II. NASDAQ trading is almost exclusively done through dealers who buy and sell securities for their own inventories. Like NYSE specialists, NASDAQ dealers use their inventory as a buffer to absorb buy and sell order imbalances. NASDAQ is actually made up of three separate markets: The Global Select Market The Global Market The Capital Market In the late 1990s, the NASDAQ system opened to electronic communications networks (ECNs) ECNs are basically websites that allow investors to trade directly with one another.
 ECNs are basically websites that allow investors to trade directly with one another.")
59
The NASDAQ System The NASDAQ network provides bid and ask prices as well as recent transaction information. The bid and ask prices for the NASDAQ represent inside quotes. The highest bid The lowest ask For a small fee, you can have access to “Level II” quotes. Displays all bids and asks Frequently displays the market maker identity

60
NYSE and NASDAQ Competitors
The third market is an off-exchange market for securities listed on an organized exchange. The fourth market is for exchange-listed securities in which investors trade directly with one another, usually through a computer network. For dually listed stocks, regional exchanges also attract substantial trading volume.

61
Trading Hours of Securities Markets
Regular Trading Session for U.S. Exchanges and Nasdaq 9:30 A.M. to 4:00 P.M. Eastern time Extended-Hours Electronic-Trading Sessions NYSE: 4:15 to 5:00 P.M. Eastern time Nasdaq: 4:00 P.M. to 6:30 P.M. Eastern time Regional exchanges also have after-hours trading sessions

62
Other Special Markets Over-the-Counter Bulletin Board (OTCBB)
Listed those “weak” companies that could not meet strict listing requirements by NASDAQ and NYSE Stocks listed in OTCCB have very low prices: microcap, penny stocks. Very thinly traded: low liquidity The Pink Sheets Similar to OTCCB The Pink Sheets does not even require the SEC filings So, should investors stay away from these stocks?

63
Stock indexes

64
Uses of Security-Market Indexes
As benchmarks to evaluate the performance of professional money managers (i.e., benchmarking) To create and monitor an index fund and exchange-traded funds (ETFs) To measure market rates of return in economic studies For predicting future market movements by technicians As a substitute for the market portfolio of risky assets when calculating the systematic risk of an asset
 To create and monitor an index fund and exchange-traded funds (ETFs) To measure market rates of return in economic studies. For predicting future market movements by technicians. As a substitute for the market portfolio of risky assets when calculating the systematic risk of an asset.")
65
Stock Market Indexes, I. Indexes can be distinguished in four ways:
The market covered, The types of stocks included, How many stocks are included, and How the index is calculated (price-weighted, e.g. DJIA, versus value-weighted, e.g. S&P 500). Stocks that do not trade during a time period cause index staleness over that time period. That is, we do not know the "true" index level if all the stock prices are not updated, i.e., fresh.
. Stocks that do not trade during a time period cause index staleness over that time period. That is, we do not know the true index level if all the stock prices are not updated, i.e., fresh.")
66
Stock Market Indexes, II.
For a price-weighted index (i.e., the DJIA), higher priced stocks receive higher weights. This means stock splits cause issues. But, stock splits can be addressed by adjusting the index divisor. Note: As of March 8, 2008, the DJIA divisor was a nice “round” ! Most popular average Comprised of 30 high quality, diversified stocks For a value-weighted index (i.e., the S&P 500), companies with larger market values have higher weights. Comprised of 500 stocks from major industry sectors More broad-based and representative of overall market than DJIA True index calculated from 1941–1943 base period closing market values
, higher priced stocks receive higher weights. This means stock splits cause issues. But, stock splits can be addressed by adjusting the index divisor. Note: As of March 8, 2008, the DJIA divisor was a nice round ! Most popular average. Comprised of 30 high quality, diversified stocks. For a value-weighted index (i.e., the S&P 500), companies with larger market values have higher weights. Comprised of 500 stocks from major industry sectors. More broad-based and representative of overall market than DJIA. True index calculated from 1941–1943 base period closing market values.")
67
Other Indexes NYSE Composite Index AMEX Composite Index
Includes all stocks listed in NYSE AMEX Composite Index Includes all stocks listed on the NYSE Amex Nasdaq Composite Index Includes all stocks traded on the Nasdaq stock market Often used to track technology companies’ behavior Value Line Composite Index Includes all stocks tracked by Value Line Uses equal weighting to eliminate the bias of stocks with large total market values Wilshire 5000 Index Includes 5,000 stocks traded on the major exchanges Russell 1000 Index Includes 1,000 largest companies Russell 2000 Index Includes 2,000 small companies Europe/Australia/Far East (EAFE MSCI) Tracks stocks trade on foreign exchanges
 Tracks stocks trade on foreign exchanges.")
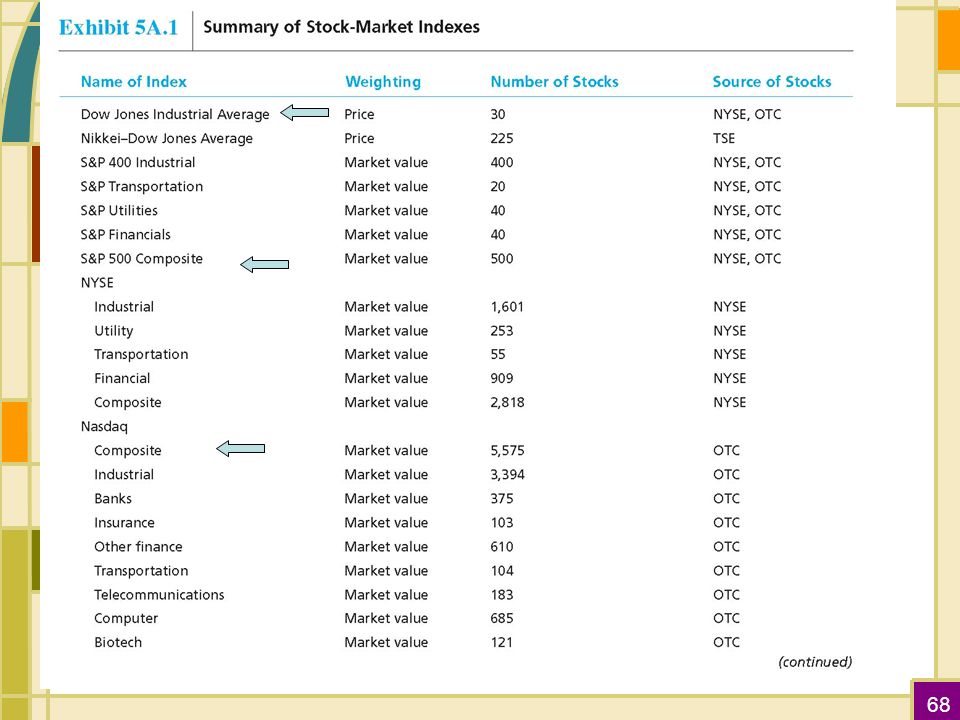
69
Stock Market Indexes

70
Stock Market Indexes

71
Correlations among Indexes

72
Stock Market Index (DJIA)
The best-known, oldest, most widely followed barometer of day-to-day stock market activity is the Dow Jones Industrial Average (DJIA), or “Dow” for short. The DJIA is a price-weighted index of the stock prices of 30 large companies representative of American industry. Dow 30: MMM, KO, IBM, PG, AXP, MCD, WMT, MSFT, GE, ……… Total the current price of the 30 stocks and divide by a divisor (adjusted for stock splits and changes in the sample)
, or Dow for short. The DJIA is a price-weighted index of the stock prices of 30 large companies representative of American industry. Dow 30: MMM, KO, IBM, PG, AXP, MCD, WMT, MSFT, GE, ……… Total the current price of the 30 stocks and divide by a divisor (adjusted for stock splits and changes in the sample)")
73
Yields on DJIA Component Stocks

74
DJIAt = ∑ (Pit/Dadj) Price-Weighted Index
Pit = Closing price of stocks i on day t Dadj= Adjusted divisor It looks simple to construct but stock splits complicates the process.

75
Example I: DJIA-Effect of Stock Split
Assume the index price-weighted index consists of three stocks, A, B, and C. This example illustrates how the index and the new divisor are computed before and after a 3-for-1 stock split for Stock A. Stock Price Before Split Price After Split A B C Index / 3 = / X = 20 Divisor X=2

76
Example II: Changing the Divisor
What would have happened to the divisor if Home Depot shares were selling at $65.72 per share?

77
DJIA-Effect of Stock Split
The example demonstrates the impact of differently priced shares on a price-weighted index. It shows that higher priced stock will affect the index more (Case A) than lower priced stock (Case B). Period T Case A (T+1) Case B (T+1) A B C Sum Divisor Average Percentage Change % %
 than lower priced stock (Case B). Period T Case A (T+1) Case B (T+1) A B C Sum Divisor Average Percentage Change 5.5% 1.7%")
78
Criticism of the DJIA Limited to 30 non-randomly selected blue-chip stocks Does not represent a vast majority of stocks The divisor needs to be adjusted every time one of the companies in the index has a stock split Introduces a downward bias by reducing weighting of fastest growing companies whose stock splits Because the index is price weighted, a high-priced stock carries more weight than a low-priced stock. A high-growth stock will have higher prices and because such stocks tend to split, they will consistently lose weight within the index.

79
Value-Weighted Series
Derive the initial total market value of all stocks used in the series Market Value = Number of Shares Outstanding X Current Market Price Assign an beginning index value (100) and new market values are compared to the base index Automatic adjustment for splits Weighting depends on market value
 and new market values are compared to the base index. Automatic adjustment for splits. Weighting depends on market value.")
80
Value-Weighted Series
Indext = index value on day t Pt = ending prices for stocks on day t Qt = number of outstanding shares on day t Ph = ending price for stocks on base day Qh = number of outstanding shares on base day

81
Value-Weighted Index

82
Example IV: How Does the Value-Weighted Index Change?
(107,892 / 104,241 )*1,000 = 1,035.02
*1,000 = 1,")
83
The Day 3 Index Can be Calculated in Two Ways:

84
The Impact of Different Values on a Market-Value-Weighted Index

85
Example A price-weighted index consists of the following four stocks. The current index divisor is What will the new divisor be if stock D does a 3-for-2 stock split? Stock Share Price A $31 B $18 C $26 D $54 A) 2.67 B) 2.74 C) 2.83 D) 2.89 E) 2.92
 B) C) D) E)")
86
Shares Beginning Ending Stock Outstanding Share Price Share Price
Example You want to create a value-weighted index of the following three stocks. If you set the beginning index equal to 100, what will the ending index value be? Shares Beginning Ending Stock Outstanding Share Price Share Price Alpha , $ $23 Beta , $ $35 Gamma 3, $ $19 A) B) C) 98.91 D) E)
 B) C) D) E)")
87
Example

88
Example You want to create a price-weighted index of the following three stocks. If you set the beginning index equal to 100, what will the ending index value be? Shares Beginning Ending Stock Outstanding Share Price Share Price Alpha , $ $23 Beta , $ $35 Gamma 3, $ $19 A) B) D) E) C)
 B) D) E) C)")
89
Example

90
Tips for Online Trades Know how to place and confirm orders
Verify stock ticker symbols Use limit orders Check and recheck orders—you pay for typos Don’t get carried away Follow a strategy but don’t get emotional Avoid or limit margin orders Double-check orders for accuracy after completion However, day trading is not recommended. Day Trader: an investor who buys and sells stocks quickly throughout the day in hopes of making quick profits Highly risky, especially if used with margin trading High brokerage commissions due to frequent trading

91
Major Full-Service, Premium Discount, and Basic Discount Brokers

92
Useful Internet Sites (information on Initial Public Offerings, or IPOs) (website for the New York Stock Exchange) (website for the NASDAQ) averages.dowjones.com (The Dow Jones Industrial Average) (the Russell Indexes) (reference for “value” and “growth” indexes) (reference for current divisor for the DIJA) (website for S&P 500) (website for Japan’s Nikkei 225 index)
 averages.dowjones.com (The Dow Jones Industrial Average) (the Russell Indexes) (reference for value and growth indexes) (reference for current divisor for the DIJA) (website for S&P 500) (website for Japan’s Nikkei 225 index)")
93
Question A prospectus provides detailed information about a firm's operations, plans, and financial position. A) True B) False
 True. B) False.")
94
Question When it comes to new security issues, the SEC:
A) analyzes the issuer's financial condition to ensure the firm is fiscally sound. B) prepares a prospectus for the issue which must be distributed to all potential investors. C) verifies that the stock is actually worth its offer price. D) has no involvement whatsoever. E) ensures that all disclosure rules have been followed.
 analyzes the issuer s financial condition to ensure the firm is fiscally sound. B) prepares a prospectus for the issue which must be distributed to all potential investors. C) verifies that the stock is actually worth its offer price. D) has no involvement whatsoever. E) ensures that all disclosure rules have been followed.")
95
Question In a price-weighted index the stocks are held in proportion to the _____ and in a value- weighted index the stocks are held in proportion to the _____. A) number of shares outstanding; total company market values B) total company market values; number of shares outstanding C) share prices; number of shares outstanding D) number of shares outstanding; share prices E) share prices; total company market values
 number of shares outstanding; total company market values. B) total company market values; number of shares outstanding. C) share prices; number of shares outstanding. D) number of shares outstanding; share prices. E) share prices; total company market values.")
96
Online trading, stock research

97
What is a Bear Market? Routine Decline: a drop of 5% or more in one of the major market indexes, like the Dow Jones Industrial Average (DJIA) Correction: a drop of 10% or more in one of the major market indexes Bear Market: a drop of 20% or more in one of the major market indexes

98
Getting Started in Investment Research
Investment Education Sites Offer tutorials, online classes and articles Examples: Investing Online Resource Center, Investor Guide.com, The Motley Fool Investments Tools Develop financial plans, set investment goals Screen stocks on a wide variety of characteristics Plot charts that track the performance of investments over time Keep track of your investments by obtaining current stock quotes as well as your overall portfolio value

99
FINRA Investment Calculator

100
Zacks Stock Screener

101
Pros and Cons of Using the Internet as an Investment Tool
Makes it easier for individuals to do research on investment and to act on that research Exercise same cautions as regular investing Remember: there is no live broker to act as a “safety net” Be skeptical of “free” advice online Know what you are buying and from whom Watch out for frequent trading High transaction costs Higher taxes on short-term gains Beware of the risks of margin trading

102
Types of Investment Information
Descriptive Information – factual data on past behavior of economy, market, industry company or given investment Analytical Information – available current data in conjunction with projections and recommendations about potential investments

103
A Report Containing Descriptive Information

104
Types of Investment Information
Economic and current events Industry and company information Information on alternative investments Price information Information on personal investment strategies

105
Sources of Investment Information
Economic and Current Event Information Finance Journals: Wall Street Journal, Barron’s, Investor’s Business Daily General newspapers: The New York Times Institutional News: Dow Jones, Bloomberg Financial Services, AP, UPI, CNNMoney Business Periodicals: Fortune, Forbes, Business Week, Kiplinger’s Personal Finance, Money, Smart Money, Worth Government Publications: Economic Report of the President, Federal Reserve Bulletin Special Subscription Services: Kiplinger Washington Letter

106
Sources of Investment Information (cont’d)
Industry and Company Information General business periodicals: Wall Street Journal, Business Week, Forbes, Fortune Trade publications: periodicals devoted to a specific industry Regulation FD: requires critical company information to be disclosed simultaneously to investment professionals and public Company Web sites Stockholders’ Reports: report published annually by publicly held corporations Form 10-K: annual statement filed with SEC by all companies with publicly traded stock Freeedgar.com: SEC-maintained website with free access to SEC filings

107
Online Sources for Industry and Company Information

108
Popular Offerings of the Major Subscription Services

109
Sources of Investment Information (cont’d)
Industry and Company Information (cont’d) Comparative Data Sources: Dun & Bradstreet’s Key Business Ratios Subscription Services: Standard & Poor’s Corporation, Mergent, Value Line Investment Survey Brokerage Reports: research reports available to brokerage firm’s clients Investment Letters: recommendations of experts in securities investment
 Comparative Data Sources: Dun & Bradstreet’s Key Business Ratios. Subscription Services: Standard & Poor’s Corporation, Mergent, Value Line Investment Survey. Brokerage Reports: research reports available to brokerage firm’s clients. Investment Letters: recommendations of experts in securities investment.")
110
Sources of Investment Information (cont’d)
Price Information Quotations: use ticker symbols to obtain current price data and statistics on companies TV sources: Bloomberg TV, CNBC, CNN Headline News

111
Symbols for Some Well-Known Companies

112
Sources of Investment Information (cont’d)
Other Online Investment Information Sources Financial Portals: supersites on the Web that combine investing features with other personal finance features Bond sites: online resources for bond and interest rate information Mutual fund sites: online resources for mutual fund information International sites: online resources for global investing, from country research to foreign currency exchange Investment discussion forums: websites where investors can exchange opinions on stocks and investing strategies (Examples: Motley Fool, Yahoo! Finance)
")
113
Sources of Investment Information (cont’d)
Avoiding Online Scams Beware of stock manipulators posting false news or overly optimistic opinions Always know your source Beware of “pump-and-dump”—promoters who hype a stock and sell out on the inflated prices Beware of “get-rich-quick”—promoters selling worthless investments to naïve buyers

114
Sources of Investment Information (cont’d)
Protect Yourself by Asking Five Key Questions: Is the seller licensed? Is the investment registered? How do the risks compare to the potential rewards? Do you understand the investment? Where you can turn for help?

Similar presentations