Download presentation
Presentation is loading. Please wait.

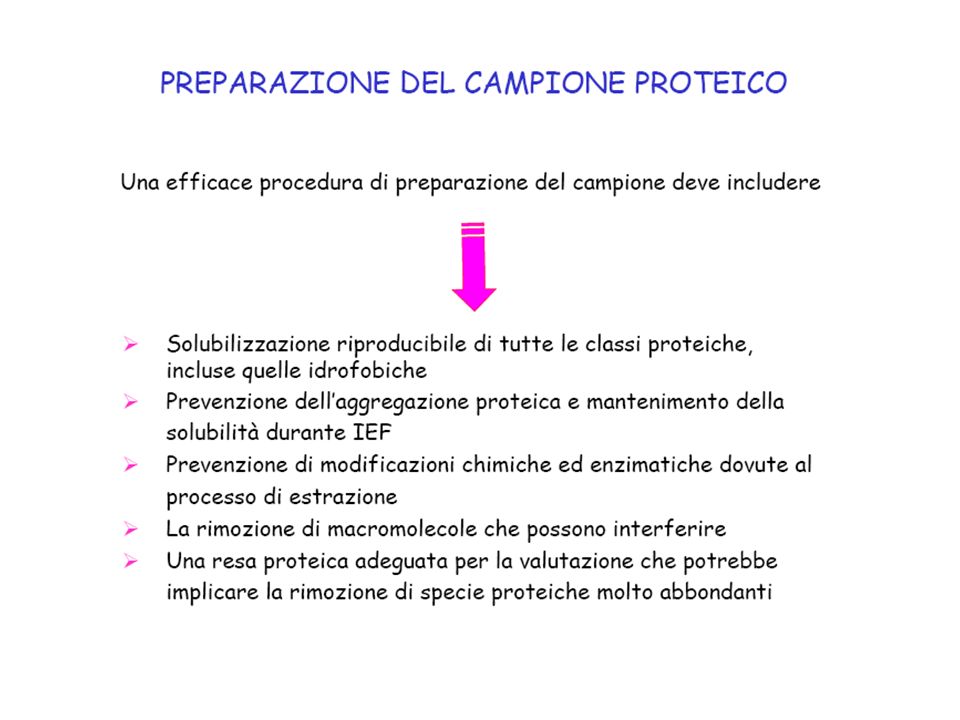
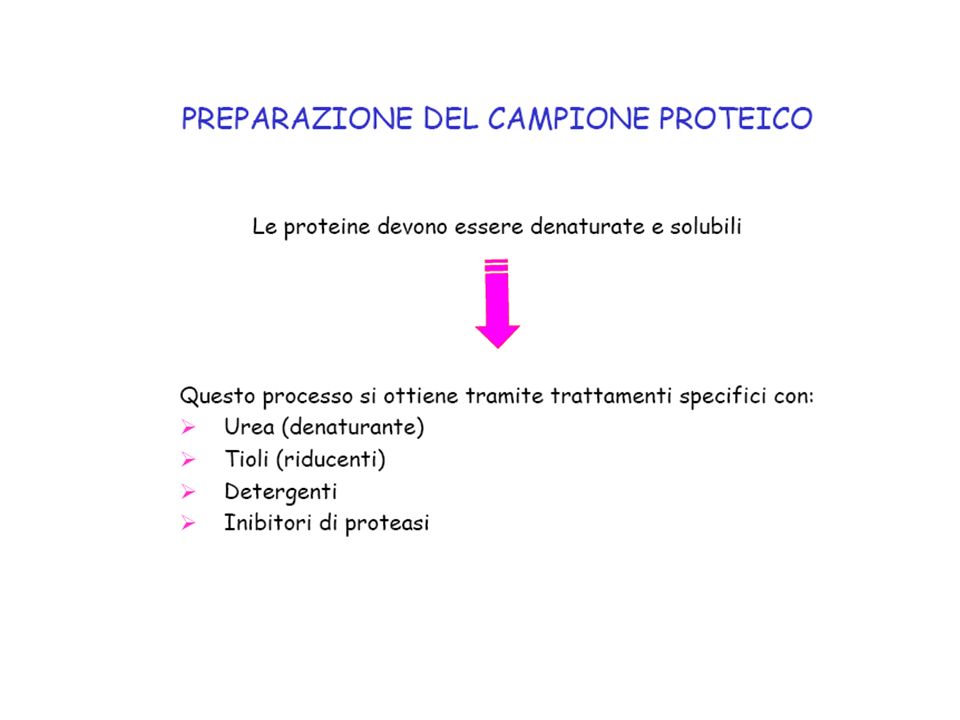
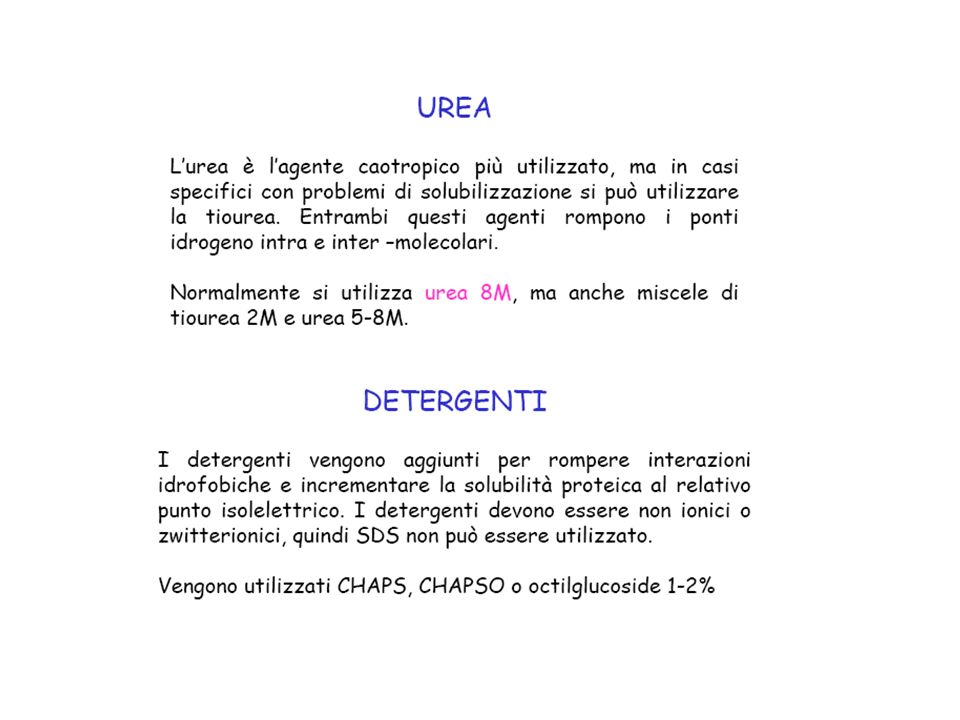
3
The Principle of Isoelectric Focusing. A pH gradient is established in a gel before loading the sample. (A) The sample is loaded and voltage is applied. The proteins will migrate to their isoelectric pH, the location at which they have no net charge. (B) The proteins form bands that can be excised and used for further experimentation.
 The sample is loaded and voltage is applied. The proteins will migrate to their isoelectric pH, the location at which they have no net charge. (B) The proteins form bands that can be excised and used for further experimentation..")
4
The principle of IEF The IEF is a very high resolution separation method, and the pI of a protein can be measured.

23
Advantage of IPG strips 1.Industrial standard (GMP) reduce variation. 2.The chemistry of the immobiline is better controllable. 3.The film-supported gel strips are easy to handle. 4.The fixed gradient are consistent during IEF. 5.Stable basic pH gradient allow reproducible results for basic proteins. 6.High protein loads are achievable. 7.Less protein loss during equilibration in SDS buffer.

28
Coomassie Blue Dyes - commonly used - does not interfere with subsequent protein identification - inexpensive - sensitivity well below silver and fluorescent dyes Silver stain - sensitivity 10-50 times greater than CB - ability to detect 1 ng of protein - silver diammine/silver nitrate - relatively expensive (reagents/waste disposal) - high background Fluorescent Stains and Dyes - accurately determine changes in protein expression - greater sensitivity than silver stain - DIGE - cost General detection methods
 - high background Fluorescent Stains and Dyes - accurately determine changes in protein expression - greater sensitivity than silver stain - DIGE - cost General detection methods")
29
2-D gel stained with the SYPRO Ruby protein gel stain and the Pro-Q Emerald 300 reagent. Combined Cohn fractions II and III from cow plasma, containing primarily α - and β -globulins, were run on a 2-D gel and stained first with the Pro-Q Emerald 300 reagent (left) and then with the SYPRO Ruby protein gel stain (right). SYPRO Ruby Rabilloud, T. et al. (2001) Proteomics 1, 699-704
 and then with the SYPRO Ruby protein gel stain (right). SYPRO Ruby Rabilloud, T. et al. (2001) Proteomics 1,")
30
Gel Staining Techniques Proteins were diluted into four aliquots. Gels A, B and C were stained with: Colloidal Coomassie Blue (Bio- Rad), SYPRO Ruby Red fluorescent stain (Bio-Rad) and silver, respectively. The fluorescent image was captured with a Gel Doc Station (Bio-Rad). The other two stain images were captured with an HP ScanJet 6200. Of these detection methods, the fluorescent stain and silver display more sensitivity than the Coomassie stain.
, SYPRO Ruby Red fluorescent stain (Bio-Rad) and silver, respectively. The fluorescent image was captured with a Gel Doc Station (Bio-Rad). The other two stain images were captured with an HP ScanJet Of these detection methods, the fluorescent stain and silver display more sensitivity than the Coomassie stain..")
37
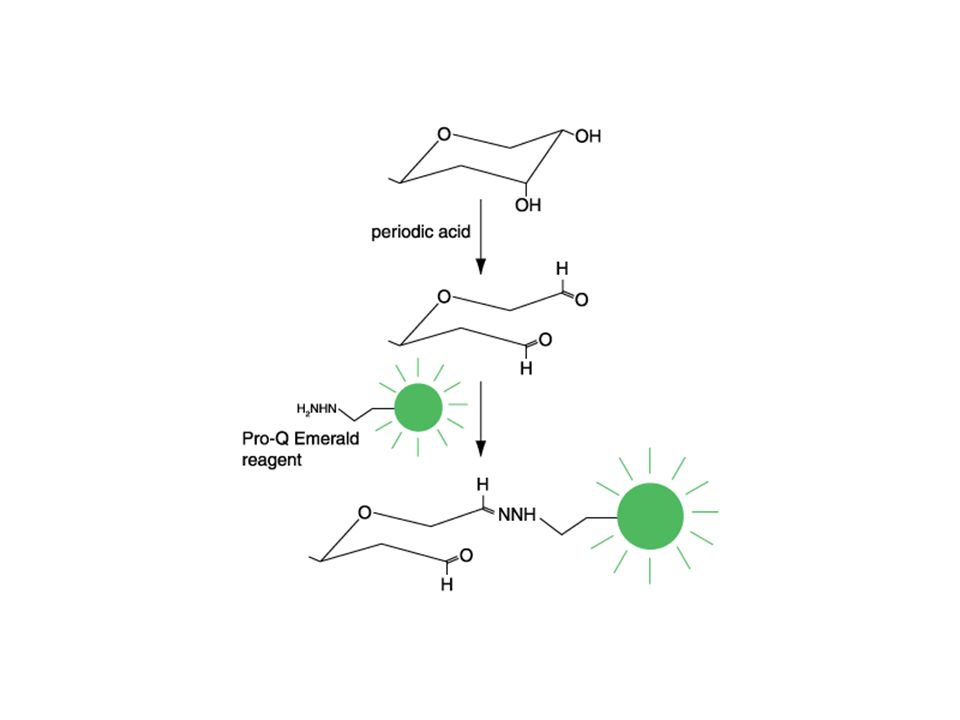
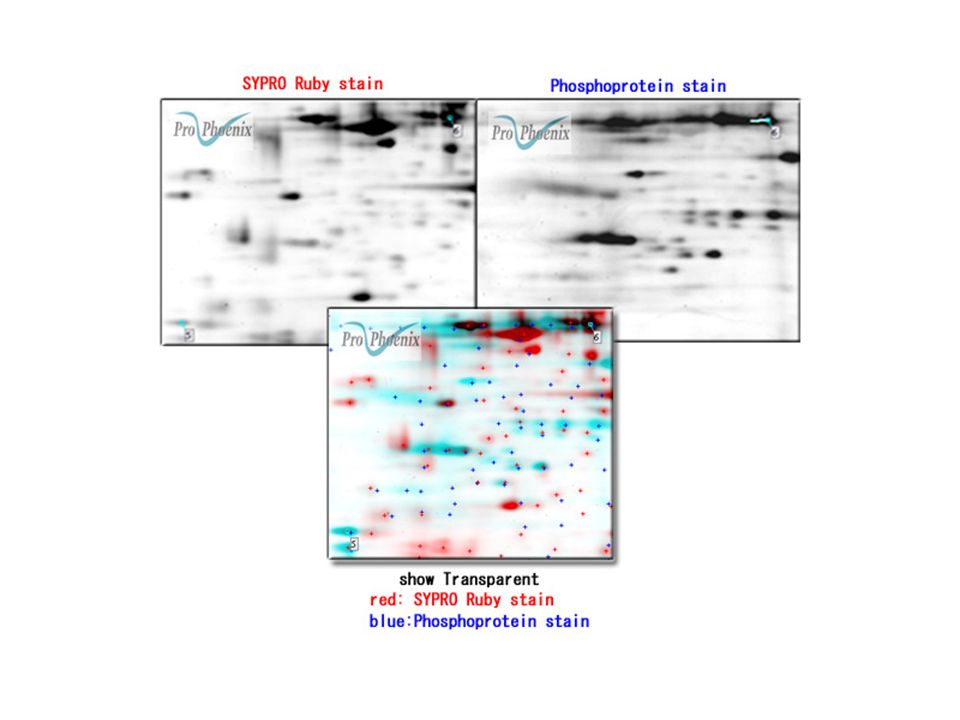
Pro-Q Diamond phosphoprotein stain can detect phosphate groups attached to tyrosine, serine or threonine residues. It is ideal for identification of kinase targets in signal transduction pathways and for phosphoproteomic studies. Signal intensity is linear over three orders of magnitude and correlates with the number of protein phosphates. Stained proteins can be accurately identified by mass spectrometry. The Pro-Q Diamond phosphoprotein gel stain is particularly useful when used in conjunction with SYPRO ® Ruby protein gel stain. The SYPRO ® Ruby dye quantitatively stains total proteins. Determining the ratio of Pro-Q Diamond dye to SYPRO ® Ruby dye signals provides a measure of the phosphorylation level normalized to the total amount of protein (see figure below). Using both stains in combination, it is possible to distinguish a lightly phosphorylated, high-abundance protein from a heavily phosphorylated, low-abundance protein.
. Using both stains in combination, it is possible to distinguish a lightly phosphorylated, high-abundance protein from a heavily phosphorylated, low-abundance protein..")
38
Restricted to proteins 10 4 Da MW Cannot detect proteins expressed at low levels Limited to 600~800 separate spots Gel to gel reproducibility is poor Quantitation is poor, ± 50% or worse Dynamic range is limited, < 10X Analysis is not directly coupled to separation DISADVANTAGES OF 2-D PAGE...

39
1.A specific point in the 2D gel imply a specific protein with certain pI value and molecular weight. 2.The signal intensity imply the expression of protein. 3.Protein pattern. 4.Protein markers.

40
The methods so far…..

42
http://au.expasy.org/melanie/Melanie.htm

43
Ge Zhou et al. Molecular & Cellular Proteomics 1:117–124, 2002. DIGE for the Identification of Cancer Markers

44
2D-PAGE IMAGE ANALYSIS BA Excise spot; elute; digest Extract peptides; MS analyze Protein identification

45
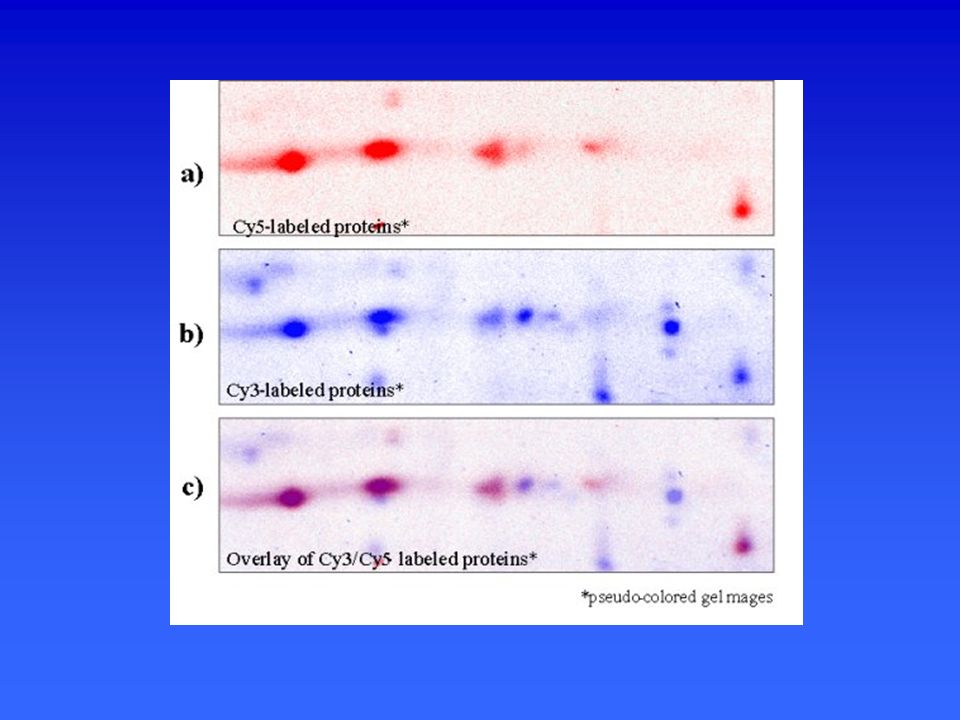
1)Proteins are extracted from the cells or tissues of interest. 2)The protein extracts are labeled with different fluorescent dyes: 3) The 2 extracts are mixed and then resolved by 2-D gel electrophoresis. Extract 1 Cy5 dye Extract 2 Cy3 dye mix Dual Channel Imaging Technique (DIGE)
The protein extracts are labeled with different fluorescent dyes: 3) The 2 extracts are mixed and then resolved by 2-D gel electrophoresis. Extract 1 Cy5 dye Extract 2 Cy3 dye mix Dual Channel Imaging Technique (DIGE).")
46
What is DiGE? Labeling two protein samples to be compared with different fluorescent dyes, and then mixing the samples before application onto the same 2D gel. The same isoform of a given protein from each sample will thus migrate to same position on the 2D gel. The relative abundance of each protein in each sample can then be obtained by scanning the gel using excitation and emission wavelengths unique to each dye used. This technique known as DiGE or differential gel electrophoresis relies on the use of the NHS esters of Cy3 and Cy5 binding to a small fraction of lysine residues within a protein sample.

47
CyDye DIGE containing NHS ester active group covalently binds to the lysine residue of a protein via an amide linkage. H 2 N- Fluorescence staining

48
The DIGE technology platform

50
The DIGE technology platform. Two different samples are derivatized with two different fluorophores, combined and then run on a single 2-D gel. Proteins are detected using a dual laser scanning device or xenon-arc-based instrument equipped with different excitation/emission filters in order to generate two separate images. The images are then matched by a computer-assisted overlay method, signals are normalized, and spots are quantified. Differences in protein expression are identified by evaluation of a pseudo-colored image and data spreadsheet. DIGE technology can maximally evaluate three different samples using Cy2-, Cy3- and Cy5- based chemistries

51
E-Cy5 E-Cy3 Excise spots; elute; digest, extract peptides; MS analyze, Protein identification

52
PSHA _1_0658 IEF (pH 4-7) PSHA _1_2360 PSHA _1_0871 PSHA _1_0021 PSHA _1_0849 PSHA _2_0363 PSHA _2_0259 PSHA _2_0420 PSHA _1_2262 PSHA _1_0328 PSHA _1_1875 PSHA _1_0255 PSHA _1_2758 PSHA _1_1059 PSHA _2_0557 PSHA _1_1740 PSHA _2_0150 PSHA _1_2771 PSHA _1_0341 PSHA _1_2145 PSHA _1_3038 PSHA _2_0144 PSHA _1_0416 PSHA _1_0689 PSHA _2_0370 PSHA _1_0119 PSHA _1_3009 PSHA _1_0870 PSHA _2_0474 PSHA _1_0595 PSHA _1_3001 PSHA _1_2400 SDS PAGE - PSHA _1_0658 PSHA _1_2360 PSHA _1_0871 PSHA _1_0021 PSHA _1_0849 PSHA _2_0363 PSHA _2_0259 PSHA _2_0420 PSHA _1_2262 PSHA _1_0328 PSHA _1_1875 PSHA _1_0255 PSHA _1_2758 PSHA _1_1059 PSHA _2_0557 PSHA _1_1740 PSHA _2_0150 PSHA _1_2771 PSHA _1_0341 PSHA _1_2145 PSHA _1_3038 PSHA _2_0144 PSHA _1_0416 PSHA _1_0689 PSHA _2_0370 PSHA _1_0119 PSHA _1_3009 PSHA _1_0870 PSHA _2_0474 PSHA _1_0595 PSHA _1_3001 PSHA _1_2400 PSHA _1_0658 PSHA _1_2360 PSHA _1_0871 PSHA _1_0021 PSHA _1_0849 PSHA _2_0363 PSHA _2_0259 PSHA _2_0420 PSHA _1_2262 PSHA _1_0328 PSHA _1_1875 PSHA _1_0255 PSHA _1_2758 PSHA _1_1059 PSHA _2_0557 PSHA _1_1740 PSHA _2_0150 PSHA _1_2771 PSHA _1_0341 PSHA _1_2145 PSHA _1_3038 PSHA _2_0144 PSHA _1_0416 PSHA _1_0689 PSHA _2_0370 PSHA _1_0119 PSHA _1_3009 PSHA _1_0870 PSHA _2_0474 PSHA _1_0595 PSHA _1_3001 PSHA _1_2400 PSHA _1_0658 PSHA _1_2360 PSHA _1_0871 PSHA _1_0021 PSHA _1_0849 PSHA _2_0363 PSHA _2_0259 PSHA _2_0420 PSHA _1_2262 PSHA _1_0328 PSHA _1_1875 PSHA _1_0255 PSHA _1_2758 PSHA _1_1059 PSHA _2_0557 PSHA _1_1740 PSHA _2_0150 PSHA _1_2771 PSHA _1_0341 PSHA _1_2145 PSHA _1_3038 PSHA _2_0144 PSHA _1_0416 PSHA _1_0689 PSHA _2_0370 PSHA _1_0119 PSHA _1_3009 PSHA _1_0870 PSHA _2_0474 PSHA _1_0595 PSHA _1_3001 PSHA _1_2400 Dual Channel Imaging Technique Green label Proteome A; Red label = Proteome B Identification of differently expressed proteins by Dual Channel Imaging Technique (DIGE)
 PSHA _1_2360 PSHA _1_0871 PSHA _1_0021 PSHA _1_0849 PSHA _2_0363 PSHA _2_0259 PSHA _2_0420 PSHA _1_2262 PSHA _1_0328 PSHA _1_1875 PSHA _1_0255 PSHA _1_2758 PSHA _1_1059 PSHA _2_0557 PSHA _1_1740 PSHA _2_0150 PSHA _1_2771 PSHA _1_0341 PSHA _1_2145 PSHA _1_3038 PSHA _2_0144 PSHA _1_0416 PSHA _1_0689 PSHA _2_0370 PSHA _1_0119 PSHA _1_3009 PSHA _1_0870 PSHA _2_0474 PSHA _1_0595 PSHA _1_3001 PSHA _1_2400 SDS PAGE - PSHA _1_0658 PSHA _1_2360 PSHA _1_0871 PSHA _1_0021 PSHA _1_0849 PSHA _2_0363 PSHA _2_0259 PSHA _2_0420 PSHA _1_2262 PSHA _1_0328 PSHA _1_1875 PSHA _1_0255 PSHA _1_2758 PSHA _1_1059 PSHA _2_0557 PSHA _1_1740 PSHA _2_0150 PSHA _1_2771 PSHA _1_0341 PSHA _1_2145 PSHA _1_3038 PSHA _2_0144 PSHA _1_0416 PSHA _1_0689 PSHA _2_0370 PSHA _1_0119 PSHA _1_3009 PSHA _1_0870 PSHA _2_0474 PSHA _1_0595 PSHA _1_3001 PSHA _1_2400 PSHA _1_0658 PSHA _1_2360 PSHA _1_0871 PSHA _1_0021 PSHA _1_0849 PSHA _2_0363 PSHA _2_0259 PSHA _2_0420 PSHA _1_2262 PSHA _1_0328 PSHA _1_1875 PSHA _1_0255 PSHA _1_2758 PSHA _1_1059 PSHA _2_0557 PSHA _1_1740 PSHA _2_0150 PSHA _1_2771 PSHA _1_0341 PSHA _1_2145 PSHA _1_3038 PSHA _2_0144 PSHA _1_0416 PSHA _1_0689 PSHA _2_0370 PSHA _1_0119 PSHA _1_3009 PSHA _1_0870 PSHA _2_0474 PSHA _1_0595 PSHA _1_3001 PSHA _1_2400 PSHA _1_0658 PSHA _1_2360 PSHA _1_0871 PSHA _1_0021 PSHA _1_0849 PSHA _2_0363 PSHA _2_0259 PSHA _2_0420 PSHA _1_2262 PSHA _1_0328 PSHA _1_1875 PSHA _1_0255 PSHA _1_2758 PSHA _1_1059 PSHA _2_0557 PSHA _1_1740 PSHA _2_0150 PSHA _1_2771 PSHA _1_0341 PSHA _1_2145 PSHA _1_3038 PSHA _2_0144 PSHA _1_0416 PSHA _1_0689 PSHA _2_0370 PSHA _1_0119 PSHA _1_3009 PSHA _1_0870 PSHA _2_0474 PSHA _1_0595 PSHA _1_3001 PSHA _1_2400 Dual Channel Imaging Technique Green label Proteome A; Red label = Proteome B Identification of differently expressed proteins by Dual Channel Imaging Technique (DIGE)")
54
profili proteici di microrganismi patogeni come Mycobacterium avium subspecies paratuberculosis, assume rilevante importanza nello studio di patologie a carattere zoonosico Immunoproteomica dei tumori: Analisi Serologica del Proteoma (SERPA) del carcinoma
 del carcinoma")
56
Idrolisi in situ nLC-MS/MS Analisi LC-MS/MS

Similar presentations


(charge)/(mass)>")


 cell populations Avoid potential expression artifacts a/w sorting Proteins: closer.>")


 SDS PAGE Isoelectric Point Isoelectric focusing.>")
 Mass spectrometry for protein identification 2-Dimensional Gel Electrophoresis MALDI-TOF.>")


