Download presentation
Presentation is loading. Please wait.

1
SOCIOECONOMIC INEQUALITIES IN HEALTH a view from Europe Johan Mackenbach Department of Public Health Erasmus MC Rotterdam, Netherlands

2
ECONOMIC PROSPERITY average income per inhabitant, 2007 CIA 2008

3
LIFE EXPECTANCY at birth, in years, men, 2008 CIA 2009

4
PROSPERITY VS. LIFE EXPECTANCY Immutable law? Deaton 2004

5
HEALTH EXPECTANCY inequalities by level of education, Netherlands, ca. 2005 CBS 2009

6
HANDGRIP STRENGTH OF THE ELDERLY IN EUROPE by level of wealth, 2005 Avendano 2006

7
The great paradox of public health: despite prosperity, more equal income distribution, welfare state, equal access to health care, … health inequalities persist, and even are widening

8
TWO RESEARCH STRATEGIES Zooming in: individuals, and how they differ in socioeconomic position, specific risk factors, and health outcomes Zooming out: societies, and how they differ in social structure, risk factor distribution, and health inequalities

9
COMPARATIVE STUDIES OF HEALTH INEQUALITIES Cross-sectional study 1980s (EU Biomed) Trend study 1980s/90s (EU Public Health) Elderly study 1990s (EU FP6) Smoking studies 1990s (EU Public Health) ‘Eurothine’ 1990s/2000s (EU Public Health) EURO-GBD-SE 2000s (EU Public Health) DEMETRIQ 1980s/1990s/2000s (EU FP7) About 60 papers in NEJM, Lancet, BMJ, JECH, IJE, SSM, EJC, IJC, Heart, EHJ, Stroke, Tob Control, …
 Trend study 1980s/90s (EU Public Health) Elderly study 1990s (EU FP6) Smoking studies 1990s (EU Public Health) ‘Eurothine’ 1990s/2000s (EU Public Health) EURO-GBD-SE 2000s (EU Public Health) DEMETRIQ 1980s/1990s/2000s (EU FP7) About 60 papers in NEJM, Lancet, BMJ, JECH, IJE, SSM, EJC, IJC, Heart, EHJ, Stroke, Tob Control, …")
10
OUTLINE Overview of results of comparative studies within Europe Interpretation: three different “regimes” of health inequalities Why health inequalities persist despite the welfare state

11
RELATIVE INEQUALITIES BY EDUCATION TOTAL MORTALITY, 1990s, MEN Mackenbach et al 2008

12
RELATIVE INEQUALITIES BY EDUCATION TOTAL MORTALITY, 1990s, WOMEN Mackenbach et al. 2008

13
MORTALITY RATES BY EDUCATION, ALL CAUSES, 2000s, MEN Lundberg et al., in prep.

14
MORTALITY RATES BY EDUCATION, ALL CAUSES, 2000s, WOMEN Lundberg et al., in prep.

15
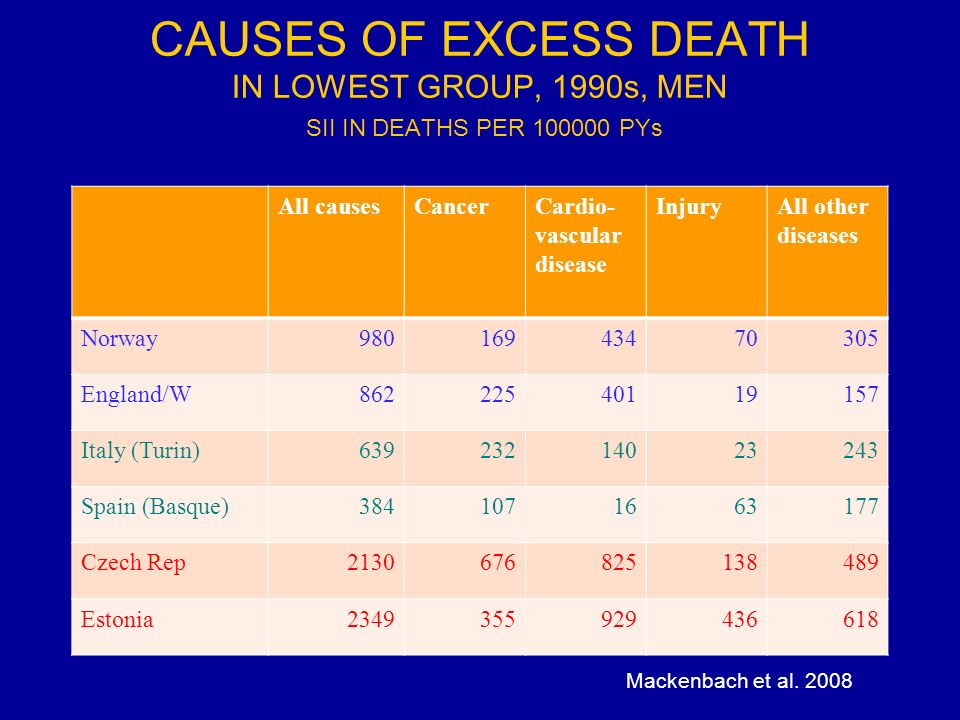
INEQUALITIES IN MORTALITY BY CAUSE OF DEATH IN EUROPE: 3 DIFFERENT “REGIMES” Northwest: large inequalities for cancer (m/w) and cardiovascular disease (m/w) South: small inequalities for cancer (w) and cardiovascular disease (m/w) East: huge inequalities for cancer (m), cardiovascular disease (m/w), and injury (m/w) Mackenbach et al. 2008

16
CAUSES OF EXCESS DEATH IN LOWEST GROUP, 1990s, MEN SII IN DEATHS PER 100000 PYs All causesCancerCardio- vascular disease InjuryAll other diseases Norway98016943470305 England/W86222540119157 Italy (Turin)63923214023243 Spain (Basque)3841071663177 Czech Rep2130676825138489 Estonia2349355929436618 Mackenbach et al. 2008
17
CAUSES OF EXCESS DEATH IN LOWEST GROUP, 1990s, WOMEN SII IN DEATHS PER 100000 PYs All causesCancerCardio- vascular disease InjuryAll other diseases Norway5181032395169 England/W462111236196 Italy (Turin)1971594-394 Spain (Basque)51-7656774 Czech Rep72614435626203 Estonia8517493109252 Mackenbach et al. 2008

18
MORTALITY RATES BY EDUCATION, ISCHEMIC HEART DISEASE, 2000s, MEN Kulhanova et al., in prep.

19
MORTALITY RATES BY EDUCATION, INJURIES, 2000s, MEN Kulhanova et al., in prep.

20
MORTALITY RATES BY EDUCATION LUNG CANCER, 2000s, MEN Kulhanova et al., in prep.

21
MORTALITY RATES BY EDUCATION, ALCOHOL-RELATED, 2000s, MEN Kulhanova et al., in prep.

22
INEQUALITIES IN HEALTH DETERMINANTS IN EUROPE: 3 DIFFERENT “REGIMES” Northwest: large inequalities for smoking (m/w), alcohol (m/w), obesity (m/w); small inequalities for health care (m/w) South: small inequalities for smoking (m/w), alcohol (w), health care (m/w); large inequalities for obesity (m/w) East: large inequalities for smoking (m), alcohol (m/w), health care (m/w); small inequalities for obesity Mackenbach et al., 2008
, alcohol (m/w), obesity (m/w); small inequalities for health care (m/w) South: small inequalities for smoking (m/w), alcohol (w), health care (m/w); large inequalities for obesity (m/w) East: large inequalities for smoking (m), alcohol (m/w), health care (m/w); small inequalities for obesity Mackenbach et al., 2008")
23
SMOKING AND OVERWEIGHT: % CONTRIBUTION TO EDUCATIONAL INEQUALITIES IN MORTALITY, MEN Eikemo et al. 2012

24
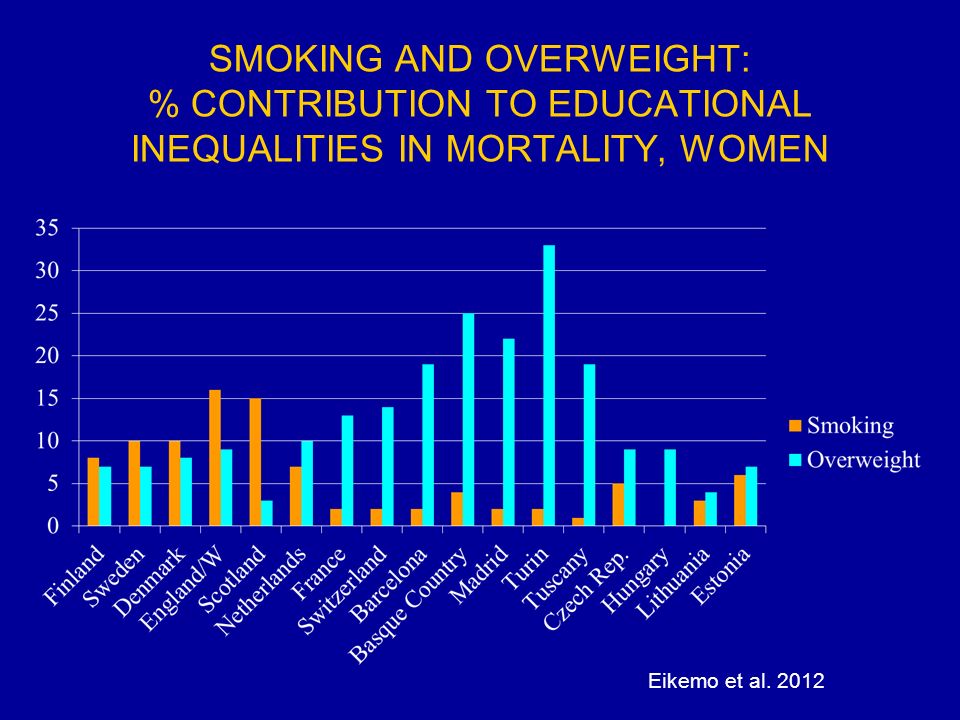
SMOKING AND OVERWEIGHT: % CONTRIBUTION TO EDUCATIONAL INEQUALITIES IN MORTALITY, WOMEN Eikemo et al. 2012
25
INCOME: % CONTRIBUTION TO EDUCATIONAL INEQUALITIES IN MORTALITY, MEN Eikemo et al. 2012

26
TRENDS IN MORTALITY BY EDUCATION, 1990s – 2000s Mortality rates, 1990s and 2000s Rate Ratios and Rate Differences, 1990s and 2000s Relative mortality change, from 1990s to 2000s Absolute mortality change, from 1990s to 2000s Change in Rate Difference by cause of death, from 1990s to 2000s Age-standardized mortality in deaths per 100,000 person-years, low versus high education

27
MORTALITY RATES (M) Mackenbach et al., in prep.
 Mackenbach et al., in prep.")
28
RATE RATIOS (M) Mackenbach et al., in prep.
 Mackenbach et al., in prep.")
29
RATE DIFFERENCES (M) Mackenbach et al., in prep.
 Mackenbach et al., in prep.")
30
RELATIVE MORTALITY CHANGE (M) Mackenbach et al., in prep.
 Mackenbach et al., in prep.")
31
ABSOLUTE MORTALITY CHANGE (M) Mackenbach et al., in prep.
 Mackenbach et al., in prep.")
32
CHANGE IN RATE DIFFERENCE BY CAUSE OF DEATH (M) Mackenbach et al., in prep.
 Mackenbach et al., in prep.")
33
WHY HEALTH INEQUALITIES PERSIST DESPITE THE WELFARE STATE (1) Inequalities in access to material and immaterial resources have not been eliminated by the welfare state Composition of lower socioeconomic groups has become more disease-prone due to selective upward social mobility Marginal benefits of higher position for health have increased due to rise of diseases determined by consumption behavior Mackenbach 2012
 Inequalities in access to material and immaterial resources have not been eliminated by the welfare state Composition of lower socioeconomic groups has become more disease-prone due to selective upward social mobility Marginal benefits of higher position for health have increased due to rise of diseases determined by consumption behavior Mackenbach 2012")
34
PERSISTENCE OF HEALTH INEQUALITIES = PERSISTENCE OF SOCIAL STRATIFICATION

35
REDISTRIBUTIVE EFFECTS OF THE WELFARE STATE Ter Rele 2007 Lifetime wages before government intervention, vs. lifetime welfare after tax, cash transfers and non-cash benefits, in thousands of Euros, Netherlands, ca. 2002

36
RISE OF INTERGENERATIONAL SOCIAL MOBILITY Education achievement by birth cohort, men, the Netherlands (%) RMO 2011
 RMO 2011")
37
WHY HEALTH INEQUALITIES PERSIST DESPITE THE WELFARE STATE (2) N-W Europe is in 4th stage of epidemiologic transition, with rapid progress against ‘diseases of affluence’, e.g. CVD Decline of these diseases is partly dependent on behaviour change, which diffuses through populations as any ‘innovation’ During this dynamic phase, higher social position confers more benefit because of greater access to ‘cultural capital’ Mackenbach 2012

38
TOBACCO CONTROL AND INEQUALITIES IN QUIT RATIOS Schaap et al. 2008

39
CONCLUSIONS (1) Socioeconomic inequalities in mortality are omnipresent throughout Europe, but magnitude varies substantially, which suggests great potential for reduction Patterns of variation between countries are not consistent with the hypothesis that more generous welfare arrangements substantially reduce inequalities in mortality Patterns of variation between countries suggest an important role of inequalities in consumption behavior (e.g., smoking and alcohol consumption)
 Socioeconomic inequalities in mortality are omnipresent throughout Europe, but magnitude varies substantially, which suggests great potential for reduction Patterns of variation between countries are not consistent with the hypothesis that more generous welfare arrangements substantially reduce inequalities in mortality Patterns of variation between countries suggest an important role of inequalities in consumption behavior (e.g., smoking and alcohol consumption)")
40
CONCLUSIONS (2) Recent trends are highly variable within Europe, with a tendency for narrowing absolute inequalities in total and CVD mortality among men in the North-West Health inequalities have persisted despite the welfare state, because it has not eliminated inequality, has increased social mobility, and has been ineffective against inequalities in consumption behavior Tackling health inequalities in high-come countries requires effective policies to reduce smoking, alcohol and other consumption-related risk factors in lower socioeconomic groups – how?
 Recent trends are highly variable within Europe, with a tendency for narrowing absolute inequalities in total and CVD mortality among men in the North-West Health inequalities have persisted despite the welfare state, because it has not eliminated inequality, has increased social mobility, and has been ineffective against inequalities in consumption behavior Tackling health inequalities in high-come countries requires effective policies to reduce smoking, alcohol and other consumption-related risk factors in lower socioeconomic groups – how")
41
SOME REFERENCES Mackenbach JP. The persistence of health inequalities in modern welfare states: The explanation of a paradox. Social Science and Medicine 2012;75:761-769. Mackenbach JP. New trends in health inequalities research: now it’s personal. Lancet 2010; 376(9744): 854- 855. Mackenbach JP, Stirbu I, Roskam AJ, et al. Socioeconomic Inequalities in Health in 22 European Countries. N Engl J Med 2008; 23: 2468-2481.
: Mackenbach JP, Stirbu I, Roskam AJ, et al. Socioeconomic Inequalities in Health in 22 European Countries. N Engl J Med 2008; 23:")
Similar presentations


 Perm Rep of Irl to EU.>")


