Download presentation
Presentation is loading. Please wait.

1
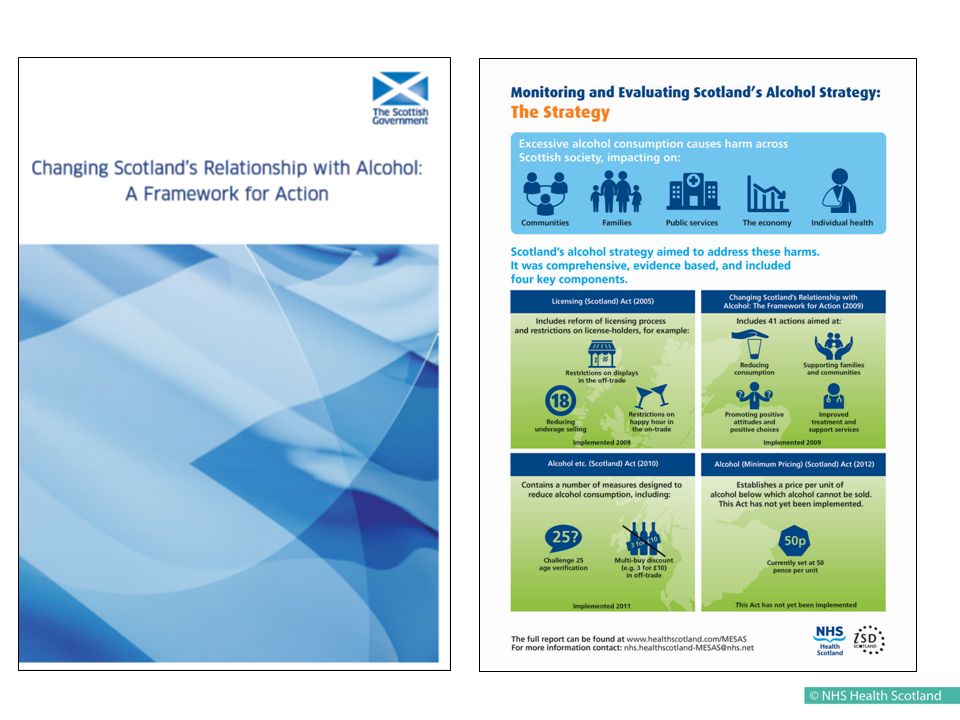
Monitoring and Evaluating Scotland’s Alcohol Strategy (MESAS) Using sales and survey data to monitor and evaluate alcohol policy: learning from MESAS Mark Robinson
 Using sales and survey data to monitor and evaluate alcohol policy: learning from MESAS Mark Robinson")
2
Alcohol-related mortality rates* 1950-2006 updated from Leon and McCambridge, Lancet 367 (2006) *As indicated by chronic liver disease mortality
 *As indicated by chronic liver disease mortality")
4
Source: General Lifestyle Survey (GB) Mean units of alcohol per week among adults in Scotland and England & Wales, by sex, 1994-2005 “The absence of high-quality alcohol consumption data, particularly on a regional and national basis, is a profound handicap to further study.” Leon & McCambridge, 2006
 Mean units of alcohol per week among adults in Scotland and England & Wales, by sex, The absence of high-quality alcohol consumption data, particularly on a regional and national basis, is a profound handicap to further study. Leon & McCambridge, 2006")
5
Learning point 1 More robust data provides more robust intelligence

6
Retail sales data On-trade (CGA)Off-trade (Nielsen)
Off-trade (Nielsen)")
7
Estimated per adult consumption in Scotland and England & Wales Source: Nielsen/CGA

8
Estimated per adult consumption in Scotland and England & Wales

9
Source: Nielsen/CGA Estimated per adult consumption in Scotland and England & Wales, by trade sector

10
Source: Nielsen Price distribution (L per adult) of spirits sold off-trade in Scotland and England & Wales, 2014
 of spirits sold off-trade in Scotland and England & Wales, 2014")
11
Weekly per adult sales, Scotland and England & Wales Source: Nielsen

12
Learning point 2 Understanding the strengths and weaknesses of data is crucial

13
“We should be concentrating on the figures for alcohol consumption, not sales” “It ignores all the alcohol bought and drunk by the 15million tourists who visit our country each year and I imagine also ignores the 700,000 immigrants resident in Scotland.” “Your methodology of taking the total amount of alcohol sold in Scotland and dividing that by the number of Scots is disingenuous and flawed – at best.” “ONS Statistics on Alcohol England 2010 shows that Scots actually drink less than their English counterparts” “The misuse of figures relating to alcohol consumption in Scotland will not cure the social factors which damage our health”

14
Validity and reliability of alcohol retail sales data Underestimated population denominator Personal exports Stockpiling Wastage/ spillage Food Scots abroad Non-inclusion of some sales outlets Personal imports Illicit alcohol Home brew Substitute alcohol Representativeness of sample frame Non-response bias Measurement error Population estimates Underestimation Overestimation

15
Validity and reliability of alcohol retail sales data Underestimated population denominator Personal exports Stockpiling Wastage/ spillage Food Scots abroad Non-inclusion of some sales outlets Personal imports Illicit alcohol Home brew Substitute alcohol Representativeness of sample frame Non-response bias Measurement error Population estimates Underestimation Overestimation Underestimate of 0.7L per adult (7% of 2013 estimate)
")
16
Learning point 3 Consider all available data

17
Consumption distribution

18
Consumption distribution and the alcohol harm paradox Source: Scottish Health Survey (2012/13 combined)
")
19
Consumption distribution and the alcohol harm paradox Source: Scottish Health Survey (2012/13 combined)
")
20
Thanks to the MESAS project team and to you for listening. Reports, papers and infographics available at healthscotland.com/MESAS

21
Source: Nielsen Price distribution (%) of alcohol sold off-trade in Scotland, 2009-2014 77% 52% <50ppu
 of alcohol sold off-trade in Scotland, % 52% <50ppu")
Similar presentations


 Dr Lesley Graham ISD.>")


 & Daniel Eisenberg (University of Michigan)>")
