Download presentation
Presentation is loading. Please wait.

1
Evidence Based Practice & Research in Nursing Level 8, Academic Year (AY) 1434—1435 H
 1434—1435 H")
2
Methods to Measure Variables

3
Key Features of Quantitative Research Refers to whether a method or measurement will repeatedly give the same result if used by the same person more than once Consistency (Reliability) Refers to the ability of methodology to measure what it is supposed to measure Accuracy (Validity)
 Refers to the ability of methodology to measure what it is supposed to measure Accuracy (Validity)")
4
Quantitative Design General Observations Specific Outcomes Qualitative Design Specific Observations General Outcomes

5
The specific and well – defined nature of the outcome measures (the research findings) means that the results of quantitative research are often capable of being generalized.
 means that the results of quantitative research are often capable of being generalized.")
6
Generalisability is an important feature of quantitative research because it allows the researcher to have a fair degree of certainty that the findings of the research apply to people that have the same, or broadly similar, characteristics as the people involved in the study.

7
Choosing what Questions to Ask Nature of the study Topic being explored Aims and Objectives of the study

8
Existing Quantitative Data Tools FocusTool Individuals’ Perceptions of their own physical and psychological well - being Short Form 36 (SF 36) www.sf-36.org Perceived state of health (Chronic Disease) Kidney Disease Quality of Life Short Form (KDQOL –SD) Quality of Life of People with Heart Disease The MacNew Heart Disease Health – related Quality of Life Instrument Physical Well - beingKarnofsky Performance Scale Index Psychological Well - BeingPsychological General Well – Being Index Social Well - BeingSocial Activities Satisfaction Instrument Emotional Well - BeingState – Trait Anxiety Index
 Perceived state of health (Chronic Disease) Kidney Disease Quality of Life Short Form (KDQOL –SD) Quality of Life of People with Heart Disease The MacNew Heart Disease Health – related Quality of Life Instrument Physical Well - beingKarnofsky Performance Scale Index Psychological Well - BeingPsychological General Well – Being Index Social Well - BeingSocial Activities Satisfaction Instrument Emotional Well - BeingState – Trait Anxiety Index")
9
Statistical Data Used to describe data 1 st step in any statistical treatment Uses measures of central tendency and variability (standard deviation) Descriptive Statistics Provide an objective way of quantifying the strength of evidence for the hypothesis To demonstrate that the findings extend beyond the sample Inferential Statistics
 Descriptive Statistics Provide an objective way of quantifying the strength of evidence for the hypothesis To demonstrate that the findings extend beyond the sample Inferential Statistics")
10
Measures of Central Tendency Arithmetic Mean: also known as average – Mean is calculated by adding all of the values Example: All the ages of people involved in the study Number of people involved in the study

11
Measures of Central Tendency Median : middle value in an ordered set of values Example: Find the median: 7, 5, 4, 6, 7, 14, 11, 5, 9, 10,12 Put the data in order: 4, 5, 5,6, 7, 7, 9, 10, 11, 12, 14 Select the middle value: 4, 5, 5,6, 7, 7, 9, 10, 11, 12, 14

12
Measures of Central Tendency Mode: most frequently occurring number in a set of observations. Example Find the mode:7, 5, 4, 6, 7, 14, 11, 5, 9, 10, 12 If there two modes: Bimodal If there are more than two modes: Multimodal

13
Measures of Central Tendency Range: is the difference between the largest observation of a data set and the smallest observation. Example: 7, 5, 4, 6, 7, 14, 11, 5, 9, 10, 12 Range: 4-14 Answer: 10

14
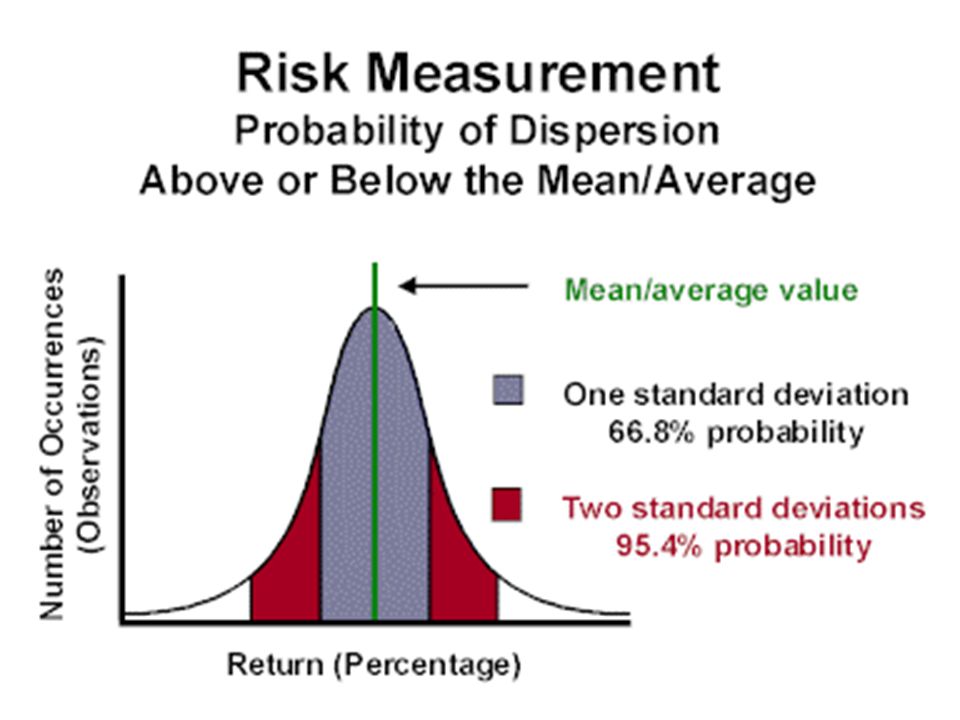
Standard Deviation Mean of the difference from the mean of each of the observations being reported. Example: 1.Find the arithmetic mean 7,5,4,6,7,14,11,5,9,10,12=8.2 2.Find the difference between each observation and the mean (7-8.2=-1.2) -1.2, -3.2, -4.2, -2.2, -1.2, 5.8, 2.8, -3.2, 0.8, 1.8, 3.8
 -1.2, -3.2, -4.2, -2.2, -1.2, 5.8, 2.8, -3.2, 0.8, 1.8, 3.8.")
15
Standard Deviation 3. Square these differences for example (-1.2 x – 1.2) = 1.44 1.44(+)10.24(+)17.64(+)1.44(+)33.64(+)7.84( +)10.24(+)0.64(+)3.24(+)14.44 4. Add together these squared differences=105.64
 = (+)10.24(+)17.64(+)1.44(+)33.64(+)7.84( +)10.24(+)0.64(+)3.24(+) Add together these squared differences=")
16
Standard Deviation 5. Divide this number by the number of observations minus one = 9.6 6. Find the square root of this number = 3.1

18
Inferential Statistics Is a word used to indicate that the statistical findings are subject to some presumption on the part of the person doing the statistics. Presented as: – Probabilities (p values) – Remain open to proved or disproved
 – Remain open to proved or disproved.")
19
Inferential Statistics A p value of 0.1 (usually written as p=0.1) would mean that there is a 10% chance that the findings of the study occurred by chance. The lower the number the better – P =0.02 vs. P=0.08

20
Inferential Statistics A p value of 0.1 (usually written as p=0.1) would mean that there is a 10% chance that the findings of the study occurred by chance. The lower the number the better

21
Data Types Basically refers to categorically discrete data such as name of your school, type of car you drive or name of a book Nominal Order Ranking of favorite sports, the order of people's place in a line, the order of runners finishing a race or more often the choice on a rating scale from 1 to 5 Ordinal The difference between 29 and 30 degrees Fahrenheit is the same magnitude as the difference between 78 and 79 Interval Ratio Interval data with natural zero point. Examples are time and temperature

22
Measures of Central Tendency that can be used with Specific Data Types MeanMedianMode NominalX OrdinalXX Interval/ Ratio XXX

23
References Sherman, R. O. & Eggenberger, T. (2008). Transitioning internationally recruited nurses into clinical settings. Journal of Continuing Education in Nursing, 39 (12), 535-44. Tombaugh, J. Mayfield, C., & Durand, R. (2011). Spiritual expression at work: exploring the active voice of workplace spirituality. Retrieved from http://search.proquest.com/docview/868257687/1417EAC B30831975A4A/1?accountid=33657
, Tombaugh, J. Mayfield, C., & Durand, R. (2011). Spiritual expression at work: exploring the active voice of workplace spirituality. Retrieved from B A4A/1 accountid=")
Similar presentations


 – Descriptive Statistics.>")
 Ordinal scale- Uses numbers for.>")


: Analysing data.>")


