Download presentation
Presentation is loading. Please wait.

1
Census Bureau Economic Programs Overview California State Data Center Affiliate Workshops March 14 - 18, 2016 Presented by: Andrew W. Hait U.S. Census Bureau

2
2 Outline Census Economic Programs Primer Key Terms Programs Overview The 2012 Economic Census and Related Programs What’s Been Released So Far What’s Coming Up (Subjects/Summary Series, ZIP Codes)
")
3
Key Economic Census Terms NAICS (North American Industry Classification System) Our primary data dimension Establishments (vs. Companies, Firms, etc.) Our collection/tabulation level Employers (vs. Nonemployers) EC only covers employer businesses U.S. Code Title 13 and 26 Protects business privacy
 Our collection/tabulation level Employers (vs. Nonemployers) EC only covers employer businesses U.S. Code Title 13 and 26 Protects business privacy.")
4
Census Economic Data Monthly and Quarterly Data Leading Economic Indicators, like the M3 and Monthly Retail Sales Annual Data Annual Survey of Manufactures County Business Patterns The Economic Census and Related Programs

5
Economic Programs - How are They Different? Monthly/Quarterly example: M3 Annual example: County Business Patterns Every 5 Years Economic Census collection Sample surveyAdministrative dataCensus industries Selected example: NAICS 3121 – Beverage Manufacturing 2- thru 6-digit NAICS example: NAICS 312120 – Breweries 2- thru 6-digit NAICS example: NAICS 312120 – Breweries geographies US Only US, State, Metro Area, County, ZIP Code All* Geographies data variables Shipments, Inventories, & Orders Number of businesses, employment, payroll 200+ 5 5

6
“Employment” Economic Data Collected from households vs businesses ACS – Households for Primary Job Detailed data by Occupation Limited data by Industry Data primarily published by residence Economic Programs – Businesses for All Jobs No data by Occupation Detailed data by Industry Data only published by business location BLS data similar to Economic Programs, but…

7
Other Current Economic Surveys Retail e-Commerce Sales (E-Stats) (census.gov/econ/estats/index.html)census.gov/econ/estats/index.html Annual Capital Expenditures Survey (census.gov/econ/aces/index.html)census.gov/econ/aces/index.html Information and Communication Technology Survey (census.gov/econ/ict/index.html)census.gov/econ/ict/index.html Statistics of U.S. Businesses (census.gov/econ/susb/index.html)census.gov/econ/susb/index.html Business Dynamics Statistics (census.gov/ces/dataproducts/bds/index.html)ensus.gov/ces/dataproducts/bds/index.html International Trade (census.gov/foreign-trade/)census.gov/foreign-trade/ Census of Governments (census.gov/govs/)
census.gov/econ/susb/index.html Business Dynamics Statistics (census.gov/ces/dataproducts/bds/index.html)ensus.gov/ces/dataproducts/bds/index.html International Trade (census.gov/foreign-trade/)census.gov/foreign-trade/ Census of Governments (census.gov/govs/).")
8
International Trade Main purposes Provide economic statistics about U.S. exports and imports at the national, state, and port levels Data also published by Commodity Classification Also responsible for issuing export regulations from the U.S. Monthly and annual data See census.gov/foreign- trade/data/index.html census.gov/foreign- trade/data/index.html

9
Statistics About Governments Main purposes Provide economic statistics about governments at the federal, state, and local area levels Serve as public-sector counterpart to private sector Track activity of governments over time Response is voluntary Virtually no confidentiality restriction

10
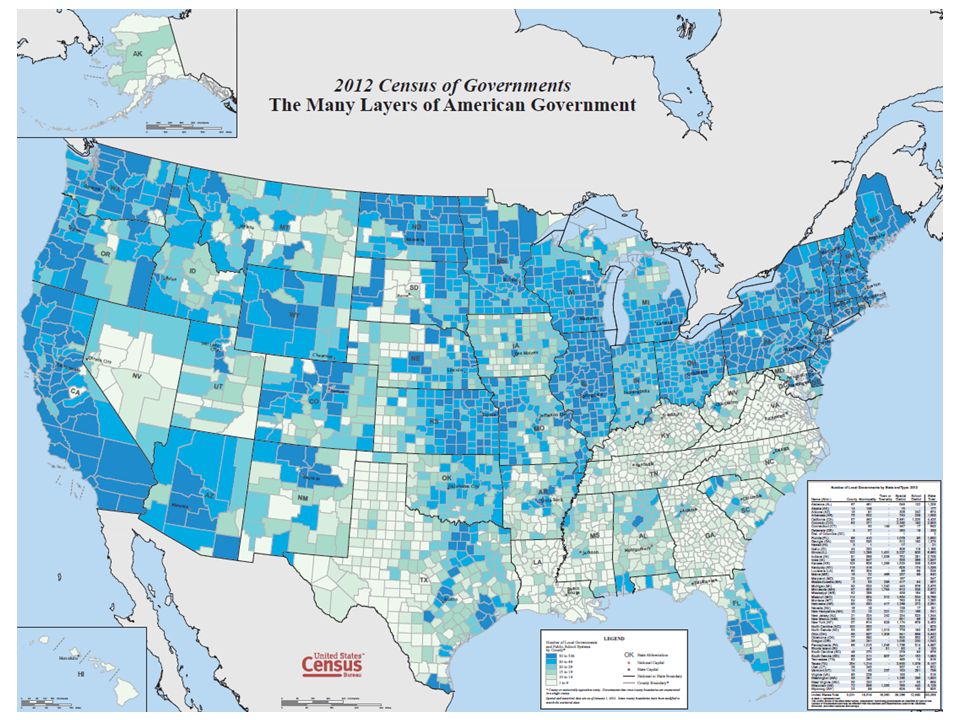
Core Programs Content Organization and Structure – Governments by type Government Employment - Full-time employees, Full- time gross payroll, Part-time employees, Part-time gross payroll, Computed FTE Government Finances - Revenue by type, Expenditure by character object & function, Debt term, Cash and Securities by type of holding See http://www.census.gov/govs/index.html for more informationhttp://www.census.gov/govs/index.html

11
90,106 Government Organizations 90,056 Local Governments 38,910 General Purpose Governments 3,031 Counties 19,519 Cities 16,360 Townships 51,146 Special Purpose Governments 38,266 Special Districts 12,880 Independent School Districts 50 State Governments Types of Governments Source: U.S. Census Bureau, 2012 Census of Governments: Organization In CA: 4,426 total (57 County, 482 Municipal, 2,861 Special Districts, and 1,025 Independent School Districts)
.")
13
Sources of Tax Revenue Percent Distribution of State Government Tax Revenue Source: U.S. Census Bureau, 2014 Survey of State Government Tax Collections Percent Distribution of State Government Tax Revenue Total %Sales Total General Sales Selective Sales License Taxes Total Income Taxes Total Individual Income Corporation Income All Other Taxes Total Property Taxes Other Taxes U.S. Average10047.531.316.25.941.235.95.3 1.63.7 Alaska1007.6X 4.212.1X 76.23.872.4 Delaware10015.1X 41.041.532.88.82.4X Florida10082.160.721.46.05.8X 6.1<.016.1 Maryland10042.422.220.24.546.341.15.26.83.83.0 California10036.227.09.36.555.749.26.41.71.60.1

14
Economic Census Done on the years ending in “2” and “7” (2012 Economic Census dissemination kickoff in March 2014) Covers employer businesses in the U.S. Covers businesses in all NAICS sectors except: Agriculture Public Sector Other selected exclusions (see census.gov/econ/census/help/naics_other_classification_systems/codes_not_covered.html) census.gov/econ/census/help/naics_other_classification_systems/codes_not_covered.html 14
 census.gov/econ/census/help/naics_other_classification_systems/codes_not_covered.html 14.")
15
The Economic Census Offers… Over 200 unique industry statistics National-, state-, metro-, county-, place-, and ZIP Code-level data (varies by sector) Industry detail: 2- thru 6-digit NAICS codes Additional cross-tabs, including: Business employment and sales size Taxable and tax exempt business Very accurate 15
 Industry detail: 2- thru 6-digit NAICS codes Additional cross-tabs, including: Business employment and sales size Taxable and tax exempt business Very accurate 15")
16
16 Business.Census.Gov

17
17 Main Page

18
Advance Report National-level data at 2- and 3-digit NAICS Released on March 26 th, 2014 18

19
Industry Series Started in May 2014 (nearly complete) National-level data only, but… More detailed NAICS Products data NAICS Changes… 19
 National-level data only, but… More detailed NAICS Products data NAICS Changes… 19")
20
New Industries for the 2012 Economic Census New and emerging industries Breakout of solar, wind, geothermal, and biomass electric power generation from All Other Electric Power Generation (NAICS 221119) Stats: Number of businesses: 673 in 2011 with 9,058 employees (435 in 2007) 20
 Stats: Number of businesses: 673 in 2011 with 9,058 employees (435 in 2007) 20")
21
Industry Changes for the 2012 Economic Census Consolidations due to decrease in number of companies due to: General industry decline Company consolidation (mergers and acquisitions) Primarily impacts the manufacturing sector (178 industries) Stats: Steel mills (880 in 2007, 570 in 2011) Machine tools (579 to 626 (cutting type) and 292 to 312 (forming type) 21
 Primarily impacts the manufacturing sector (178 industries) Stats: Steel mills (880 in 2007, 570 in 2011) Machine tools (579 to 626 (cutting type) and 292 to 312 (forming type) 21")
22
Other Industry Changes Changes to (and consolidation of ) existing industries due to market change Primarily impact the Retail and A&F sectors Stats Computer Stores: 12,411 in 2007, 10,292 in 2011 Camera Stores: 2,049 to 1,115 Music Stores: 4,496 to 2,379 22
 existing industries due to market change Primarily impact the Retail and A&F sectors Stats Computer Stores: 12,411 in 2007, 10,292 in 2011 Camera Stores: 2,049 to 1,115 Music Stores: 4,496 to 2,379 22")
23
23 What’s New Page

24
Where Else Can I Go for More Information? NAICS web site (http://www.census.gov/eos/www/naics/)http://www.census.gov/eos/www/naics/ Industry definitions and Concordance tables Relationships to other systems Federal Register Notices 24

25
25 Finding Data Page A new home for the ISP … and the Snapshots (http://www.census. gov/econ/snapshots /index.php)http://www.census. gov/econ/snapshots /index.php
 gov/econ/snapshots /index.php.")
26
Geographic Area Series Kicked off on January 27, 2015 with release of Manufacturing data National-, state- county-, metro area-, and economic place-level data Full NAICS detail LOTS of Changes… 26

27
New Places 2007 EC cutoff: 5,000+ pop or jobs 2012 EC cutoff: 2,500+ pop or jobs Results in over 5,000 new places published for 2012 245 added for CA (now 890) 27
 27")
28
Place Changes Adds / Drops Boundary Changes New Incorporations / Unincorporations 28

29
Metro Changes New CSAs Changed CSAs Changed Metro and Micro Areas Unchanged Metros 29

30
Reference Maps - ABAG 30

31
Reference Maps - SJCOG 31

32
Reference Maps - SACOG 32

33
Reference Maps - SANDAG 33

34
Reference Maps - Imperial 34

35
Reference Maps - RCEDA 35

36
Reference Maps - SCAG 36

37
More Sectors 37

38
Other Geographic Changes No pub cutoffs 6 New Counties in AK Planning Areas in PR Geographic Components Offshore Areas “Statewide” Areas Non-Metro Areas 38

39
39 Help Center Page 2012 EC Geo Reference info

40
What’s Coming Subjects and Summary Series Summary Reports Product Lines Estab & Firm Size Miscellaneous Subjects ZIP Code Statistics 40

41
Census-Related Programs Commodity Flow Survey (CFS) - Selected national- and finer-level data on the movement of products across the U.S. by mode of transportation (plus other breakouts). (http://www.census.gov/econ/cfs/) Economic Census of Island Areas – Selected industry, product, and other data for American Samoa, Guam, the Northern Mariana Islands, Puerto Rico, and the U.S. Virgin Islands. (http://www.census.gov/econ/islandareas/) Survey of Business Owners (SBO) – Selected national- and finer- level industry data for women- and minority-owned businesses and the characteristics of all businesses and their owners. (http://www.census.gov/econ/sbo/)
. ( Economic Census of Island Areas – Selected industry, product, and other data for American Samoa, Guam, the Northern Mariana Islands, Puerto Rico, and the U.S. Virgin Islands. ( Survey of Business Owners (SBO) – Selected national- and finer- level industry data for women- and minority-owned businesses and the characteristics of all businesses and their owners. (")
42
42 Summary Census economic data can help you and your customers understand the California economy The 2012 Economic Census provides a wealth of data for you and your users Most are released More coming business.census.gov site has a lot of useful materials for you and your users

43
Questions 43

44
Thank You Contact me at: andrew.w.hait@census.gov (301)763-6747 andrew.w.hait@census.gov 44
")
Similar presentations


 Webinar # 3 of 4 February 26 th, 2014 Andrew.>")


 Webinar # 2 of 4 February 12 th, 2014 Andrew W. Hait.>")