Download presentation
Presentation is loading. Please wait.

1
Satellite Derived Ocean Surface Vector Winds Joe Sienkiewicz, NOAA/NWS Ocean Prediction Center Zorana Jelenak, UCAR/NOAA NESDIS

2
Direct Measurements Buoy, Ships –Pros Provide frequent updates at a single point, meeting or exceeding 1-hr refresh Provide reference points for real-time diagnostics in the generation of the forecast/warning package Complements synoptic scale satellite information by providing a frequently updated reference measurement –Cons Limited coverage – only provide limited point measurements

3
Indirect Measurements OSCAT Descending Passes ASCAT Descending Passes Wind speed and direction information needs to be derived from satellite measurements

4
NSCAT August 1996 Wind Vector Measurements Through History Stick Scatterometer ERS 1 & 2 Aug 1991, April 1995 Stick Scatterometer SeaSAT 1978 110 days SeaWinds+AMSR Dec 2002 Pencil-beam Scatterometer QuikSCAT June 1999-Nov 2009 Stick Scatterometer ASCAT-B Sep 2012 C-band Ku-band Pencil-beam Scatterometer OceanSat-2 Sep 2009 ASCAT Oct 2006

5
What are Scatterometers? Microwave Radars on Polar orbiters –C-band ~5GHz (~5cm), Ku-band ~14GHz (~2cm) C-band (less impacted by rain than Ku) Ku-band (rain impact) –designed to measure ocean surface backscatter ( 0 ) Capillary waves infer wind speed –Multiple samples from different azimuth angles wind direction solutions
, Ku-band ~14GHz (~2cm) C-band (less impacted by rain than Ku) Ku-band (rain impact) –designed to measure ocean surface backscatter ( 0 ) Capillary waves infer wind speed –Multiple samples from different azimuth angles wind direction solutions.")
7
7 QuikSCAT Measurement Geometry WVC – Wind Vector Cell 25km → 76 WVC across swath

8
Far Swath Mid Swath Nadir H-pol V-pol 4 observations good azimuth diversity 4 observations poor azimuth diversity 2 observations Measurement Geometry

9
4-Look Solution Most likely solution U=10m/s, χ=150°

11
16 December 2009 Rain Effects The radar signal is attenuated by the rain as it travels to and from the Earth’s surface σ 0 Retrieved wind speed The radar signal is scattered by the raindrops. Some of this scattered energy returns to the instrument σ 0 Retrieved wind speed The roughness of the sea surface is increased because of the splashing due to raindrops σ 0 Retrieved wind speed Directional information can be lost 11

13
A S C A T R A C K

14
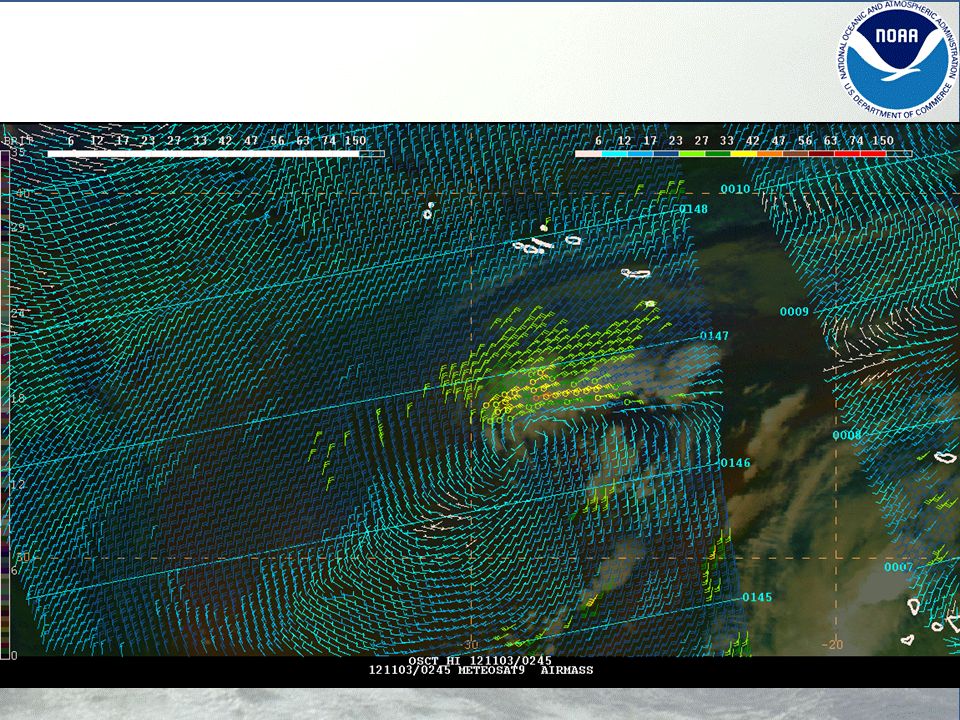
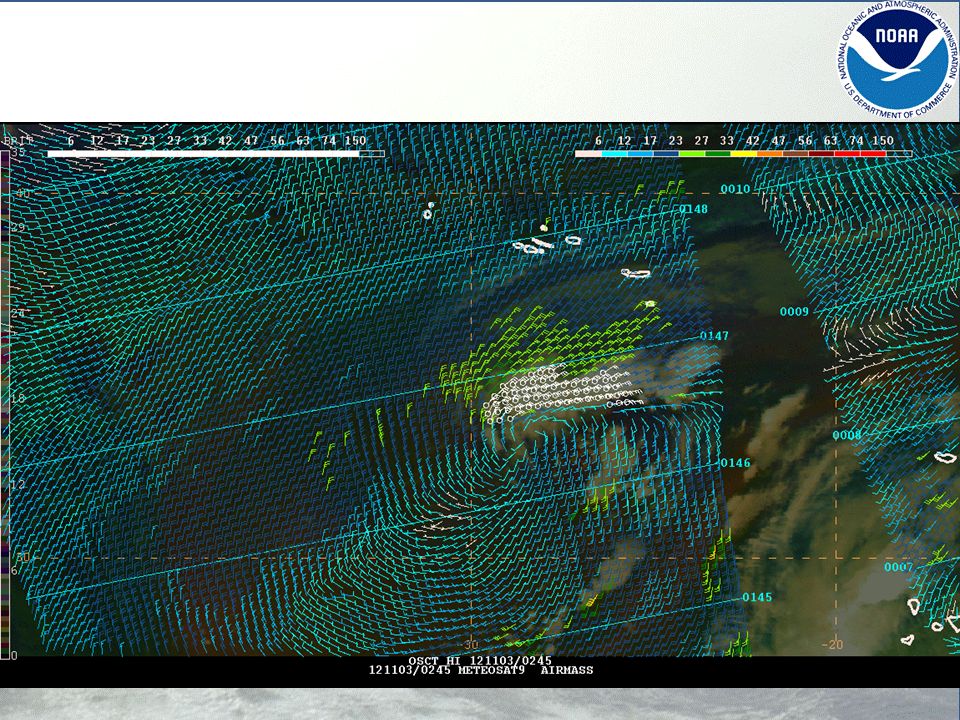
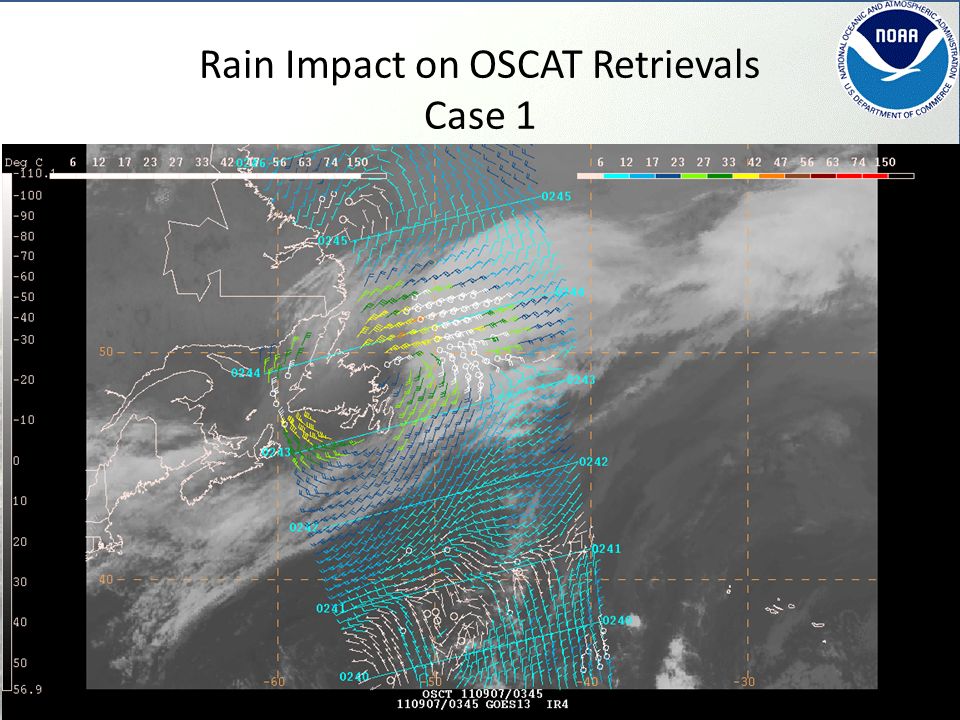
O S C A T R A C K

17
Rain Impact on OSCAT Retrievals Case 1

21
SUPER STORM Sandy – ASCAT 1419 UTC29 Oct 2012

22
NOAA Ocean Prediction Center – scatterometer impacts on operations OSCAT and ASCAT Forecasters use every pass to: make warning and short-term forecast decisions and to estimate - cyclone location, intensity, extent of wind field - strength and extent of orographically enhanced jets - wind field near strong SST gradients Results in improved warning and forecast services over otherwise data sparse oceans

Similar presentations


 MS Thesis Project Santhosh Vasudevan End of Semester.>")


, Julia Figa-Saldaña (EUMETSAT), BS Gohil (ISRO) CEOS SIT-29 Meeting CNES, Toulouse, France 9 th -10 th April.>")


 Special Thanks to: Michael Brennan.>")

