Download presentation
Presentation is loading. Please wait.

1
Socio-Economic and Demographic Change in Pennsylvania: Implications for Extension Stephan J. Goetz 1, Yicheol Han 2 1.Professor of Agricultural and Regional Economics and Director, The Northeast Regional Center for Rural Development and NARDeP, Penn State University 2.Post Doctoral Fellow, NERCRD and NARDeP With special appreciation to Jonathan Johnson from the Center for Rural Pennsylvania, for providing selected charts. Prepared for the Penn State Extension Conference 2014 Penn Stater Conference Center April 22, 2014

2
Presentation Outline 1.Population Topics Numbers Diversity Education Aging Migration 2.Employment 3.Wealth 4.Health and Substance Abuse 5.Other Trends 6.Conclusion Presentation is available at aese.psu.edu/nercrd/presentations

3
1. Population Topics: Numbers

4
Metro areas are gaining, rural areas continue to lose population…. Population Change, 2000-2010

5
Population density, 2008-2012 Data: US Census, American Community Survey, 2008-2012, population per km 2

6
Change in Population, 1980 to 2010 and 2010 to 2040 (projected) Population Change, 1980 to 2010 Population Change, 2010 to 2040 Data sources: U.S. Census Bureau and Pennsylvania State Data Center

7
Data Sources Projections were developed by Pennsylvania State Data Center in 2013 Projections are based on the demographic cohort component model – Base population, Census 2010 – Group quarters populations are held constant – Applied national fertility and survival rates to Pennsylvania Projections are just that– projections – Useful window to understanding and preparing for change

8
1. Population Topics: Diversity

9
Northeast is Part of Rapid Minority Population Gains, 2000-2010

10
Minority population (%) Data: US Census, American Community Survey, 2008-2012 Minority refers to people who reported their ethnicity and race as something other than non-Hispanic White alone
 Data: US Census, American Community Survey, Minority refers to people who reported their ethnicity and race as something other than non-Hispanic White alone")
11
Foreign-Born (%), 2008-2012 Data: US Census, American Community Survey, 2008-2012
, Data: US Census, American Community Survey,")
12
Data: US Census 2000 and 2010 Northeast’s ethnic population

13
Data: US Census 2010 PA’s Ethnic Population

14
Market opportunity (Korean) Data: US Census, American Community Survey, 2008-2012
 Data: US Census, American Community Survey,")
15
Market opportunity (Chinese) Data: US Census, American Community Survey, 2008-2012
 Data: US Census, American Community Survey,")
16
Market opportunity (Arab) Data: US Census, American Community Survey, 2008-2012
 Data: US Census, American Community Survey,")
17
Market opportunity (Russian) Data: US Census, American Community Survey, 2008-2012
 Data: US Census, American Community Survey,")
18
1. Population Topics: Education

19
High school or college

20
High school or more Percent of population 25 years and over who have completed high school or more education Data: US Census, American Community Survey, 2008-2012

21
Bachelor’s degree or more Percent of population 25 years and over who have completed bachelor’s degree or more education Data: US Census, American Community Survey, 2008-2012

22
Data: US Census 2000 and American Community Survey 2008-2012 College or more, absolute change in percentage points since 2000

23
1. Population Topics: Aging

24
Rural Pennsylvania Age Cohorts Blue = % Pop. Males Yellow = % Pop. Females Red = Baby Boomers, Born 1946-64 1970 2010 2040 (proj) Data sources: U.S. Census Bureau and Pennsylvania State Data Center
 Data sources: U.S. Census Bureau and Pennsylvania State Data Center.")
25
Number of Youth and Senior Citizens in Rural and Urban Pennsylvania, 1950 to 2040 (projected) Data sources: U.S. Census Bureau and Pennsylvania State Data Center

26
Age Dependency Ratio, 1960-2040 (proj.) (# Persons Age <20 + Persons Age 65+)/(Persons Age 20 to 64)
 (# Persons Age <20 + Persons Age 65+)/(Persons Age 20 to 64)")
27
Percent of population under age 18 Data: US Census, American Community Survey, 2008-2012 Youth Population

28
Youth Population Change Population under age18, percent of total Data: US Census, American Community Survey, 2005-2009 and 2008-2012

29
Elderly population Population 65 year or older, percent of total Data: US Census, American Community Survey, 2008-2012

30
Age Dependency Ratios, 2010 and 2040 (projected) 2010 2040 (projected) *Age Dependency Ratio (# Persons <20 + # Persons 65+) (# Persons 20 to 64) Data source: U.S. Census Bureau and Pennsylvania State Data Center

31
1. Population Topics: Migration

32
Mover rate by age

33
Net migration trend

34
In-Migration by County, 2010 to 2040 (projected) Data sources: U.S. Census Bureau and Pennsylvania State Data Center

35
2. Employment

36
Per Capita Employment (Parallels the Age-Dependency Ratio from above) Data: US Census, American Community Survey, 2008-2012
 Data: US Census, American Community Survey,")
37
Employment Change 2000-2008 Data Source: Bureau of Economic Analysis

38
Employment Change 2008-2011 See also: http://www.nardep.info/upl oads/DataBrief1_Jobs.pdf Data Source: Bureau of Economic Analysis

39
3. Income and Wealth

41
Poverty Rates, 2008-2012 Data: US Census, American Community Survey, 2008-2012 USDA’s 2020 Initiative: (20% of funds to regions with >20% poverty rate)
")
42
Per capita dividends, interest, and rent payments, 2008-2012 change Data Source: Bureau of Economic Analysis

43
Climbing the Income Ladder (Chetty et al. 2013) What helped mobility: 1.Mixed income neighborhoods 2.Two-Parent Households 3.**Smaller African- American Population 4.Social Capital The chance that a child born in the bottom fifth rose to the top fifth **but not necessarily linked to race; Whites equally affected (e.g., Atlanta)
 What helped mobility: 1.Mixed income neighborhoods 2.Two-Parent Households 3.**Smaller African- American Population 4.Social Capital The chance that a child born in the bottom fifth rose to the top fifth **but not necessarily linked to race; Whites equally affected (e.g., Atlanta).")
44
http://www.nytimes.com/2013/07/22/business/in-climbing-income-ladder-location-matters.html?_r=0 Chances of Ending Up in the Top Fifth, For a Child...... Raised in the Bottom Fifth (parents’ income less than $25k)... Raised in the Top Fifth (parents’ income more than $107k)
... Raised in the Top Fifth (parents’ income more than $107k).")
45
4. Health and Substance Abuse

46
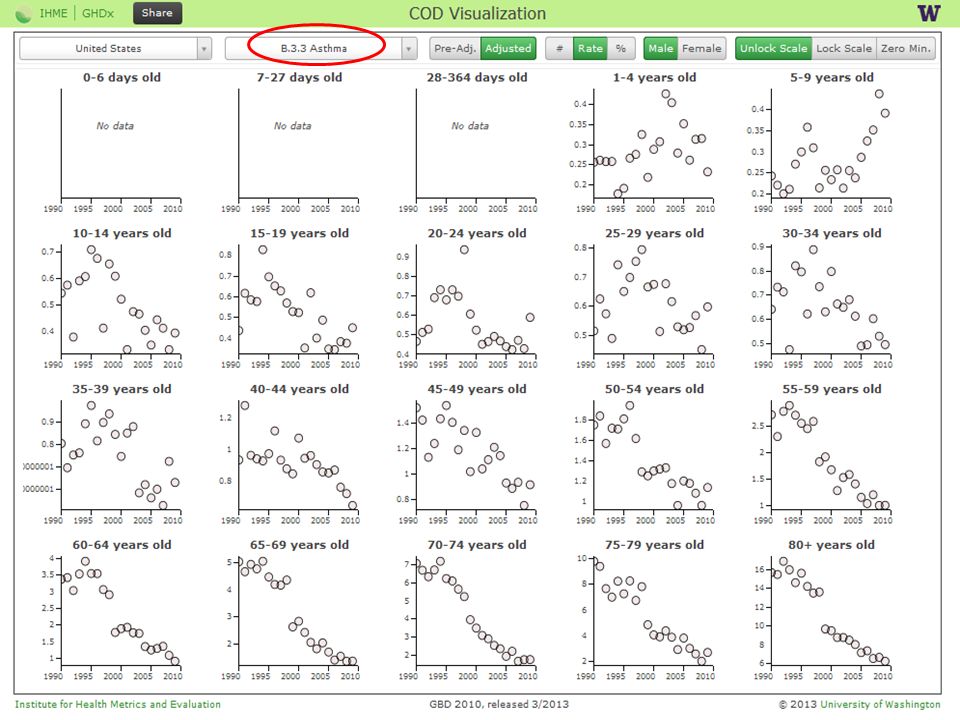
http://www.healthmetricsandevaluation.org/

48
Health Data (county-level) http://www.healthmetricsandevaluation.org/
")
49
Substance Abuse, Mental Health

51
Excessive Drinking change Data: County Health Rankings & Roadmaps 2002-2008 and 2006-2012

53
Poor mental health days Data: County Health Rankings & Roadmaps, 2006-2012

54
Poor mental health days change Data: County Health Rankings & Roadmaps 2002-2008 and 2006-2012

55
For more information about the Regional Rural Development Centers’ SAMHSA/DHHS- funded CAPE Project, please visit www.healthbench.info CAPE - Community Assessment and Education to Promote Behavioral Health Planning and Evaluation

56
5. Other Trends

57
Same-Sex Couple HHs

58
Multigenerational HHs

59
Percent Change in Wage-and-Salary Jobs vs. Self- Employment, The Northeast US, 2001-2011 Data Source: Bureau of Economic Analysis

60
Percent Change in Wage-and-Salary Jobs vs. Self- Employment, The Northeast US, 2001-2011 Data Source: Bureau of Economic Analysis

61
6. Implications

62
Families/Households Selected Types of Households in Rural Pennsylvania, 1980 to 2010 Smaller households Fewer households with children Potential increase in the number of multi-generational households Likely increase in single person households Data Source: U.S. Census Bureau

63
Economic Development # Working Age Adults (20-64) in Rural Pennsylvania 1950 - 2040 (proj.) Potential labor shortages for some businesses More older persons in the workforce Stagnant or lower income tax revenues Increased demand for businesses to serve an older population Data Sources: U.S. Census Bureau & Pennsylvania State Data Center

64
Education No initial reduction in school taxes Potential school building closings in some districts– new buildings in other districts Data Source: Pennsylvania Department of Education Enrollment Changes 2010 to 2020 (proj.)
")
65
Number of Rural and Urban Persons 85 Years Old & Older, 1960, 2040 (projected) Health Care / Human Services Data Source: U.S. Census Bureau and PA Dept. Health Likely increased demand for: –Home health care services –Transportation services –Assisted living quarters –Medical specialists focusing on geriatric needs Are communities ready for this sea change?

66
Final Words Powerful Forces are in Play in Pennsylvania: 1.Demographic… and 2.Social and Economic Change … and they play out unevenly across the State, creating problems AND opportunities for Extension This presentation included only a relatively(!) small set of data. Please contact us for additional data, maps, tables, etc. (sgoetz@psu.edu or yuh14@psu.edu).sgoetz@psu.edu yuh14@psu.edu Presentation will be available at www.nercrd.psu.edu

67
http://www.equality-of-opportunity.org 1.Mixed income Neighborhood 2.Two parent HHs 3.African-American population 4.Social Capital Chetty et al. (2013): Mobility This map shows the average percentile rank of children who grow up in below-median income families across areas of the U.S. (absolute upward mobility). Lighter colors represent areas where children from low-income families are more likely to move up in the income distribution.
: Mobility This map shows the average percentile rank of children who grow up in below-median income families across areas of the U.S. (absolute upward mobility). Lighter colors represent areas where children from low-income families are more likely to move up in the income distribution..")
Similar presentations


 981-4076>")


 Demographic Highlights TEXAS is: big. The population.>")


