Download presentation
Presentation is loading. Please wait.

1
CHAPTER 2 ORGANIZING AND PRESENTING DATA

2
CONTINUOUS AND DISCRETE DATA Continuous data are numerical measurements that can assume any value between two numbers. Discrete data are numerical values that can assume only a limited number of values.

3
EX 2.2, PG 35 For each of the following: a) Identify each variable and classify as either categorical or numerical, and b) If the variable is numerical, then further classify it as either continuous or discrete. 1) a person’s height 2) an individual’s political affiliation 3) the number of rainy days in July 4) the number of gallons of fuel used to travel from New York to Chicago 5) a person’s hair color 6) an opinion to the question: “Is the President of the United States doing a good job?” 7) a shoe size 8) the number of inches of snowfall per year 9) the number of vowels in a paragraph 10) the amount of soda in a 2 liter bottle 11) a student’s credit load for the semester
 a person’s height 2) an individual’s political affiliation 3) the number of rainy days in July 4) the number of gallons of fuel used to travel from New York to Chicago 5) a person’s hair color 6) an opinion to the question: Is the President of the United States doing a good job 7) a shoe size 8) the number of inches of snowfall per year 9) the number of vowels in a paragraph 10) the amount of soda in a 2 liter bottle 11) a student’s credit load for the semester.")
4
SOLUTION: 1) A person’s height is a numerical variable. Since it is a measurement that has been rounded off, it is continuous. 2) Political affiliation is a categorical variable. 3) The number of rainy days in July is a numerical variable. Since this number represents count data, it is discrete. 4) The number of gallons of fuel used to travel from New York to Chicago is a numerical variable. It is a measurement that has been rounded off and is continuous. 5) A person’s hair color is a categorical variable. 6) One’s opinion is a categorical variable. 7) Shoe size is a numerical variable. Since shoe sizes can only take on a limited number of values, it is discrete. 8) The number of inches of snow is a numerical variable which represents a rounded off measurement. Thus it is continuous. 9) The number of vowels in a paragraph represents a numerical variable. Since this number is count data, it is discrete. 10) The amount of soda in a 2 liter bottle is a numerical variable. The amount represents a measurement that has been rounded off. Therefore, it is continuous. 11) The number of credits is a numerical variable. Since the number of credits can only take on a limited number of values, it is discrete. ■
 Political affiliation is a categorical variable. 3) The number of rainy days in July is a numerical variable. Since this number represents count data, it is discrete. 4) The number of gallons of fuel used to travel from New York to Chicago is a numerical variable. It is a measurement that has been rounded off and is continuous. 5) A person’s hair color is a categorical variable. 6) One’s opinion is a categorical variable. 7) Shoe size is a numerical variable. Since shoe sizes can only take on a limited number of values, it is discrete. 8) The number of inches of snow is a numerical variable which represents a rounded off measurement. Thus it is continuous. 9) The number of vowels in a paragraph represents a numerical variable. Since this number is count data, it is discrete. 10) The amount of soda in a 2 liter bottle is a numerical variable. The amount represents a measurement that has been rounded off. Therefore, it is continuous. 11) The number of credits is a numerical variable. Since the number of credits can only take on a limited number of values, it is discrete. ■.")
5
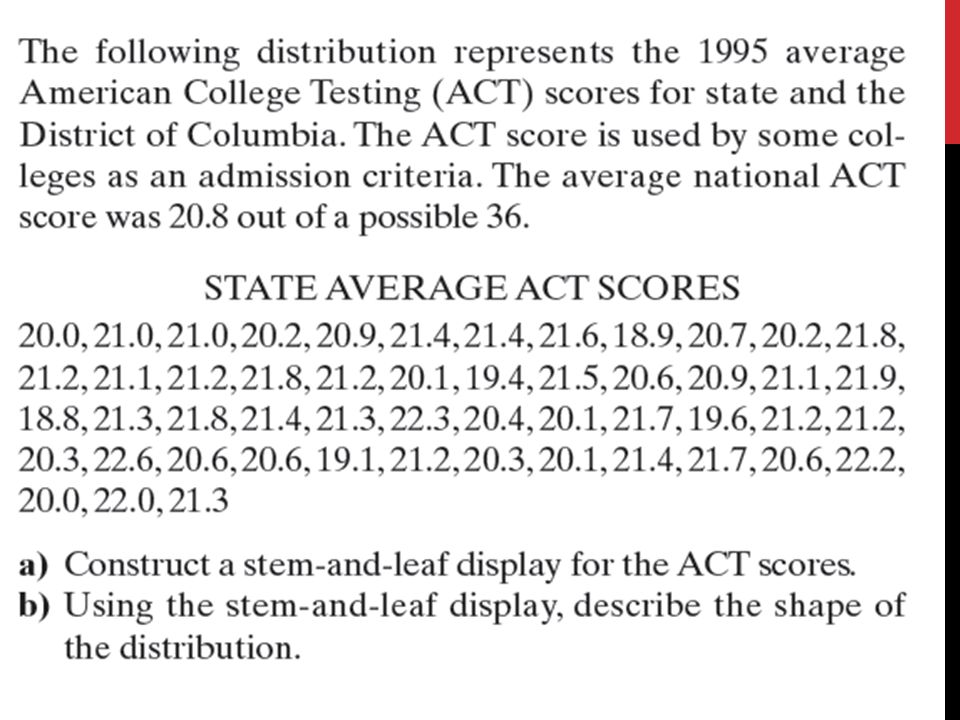
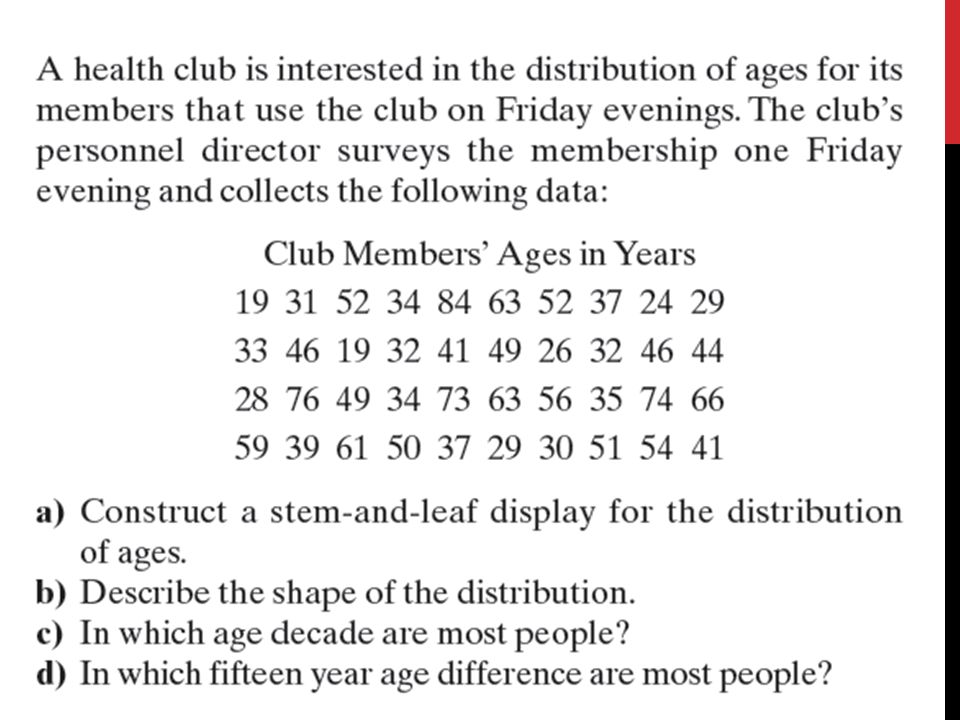
EXPLORING DATA USING THE STEM-AND-LEAF DISPLAY A stem-and-leaf display is a visual exploratory data analysis technique that shows the shape of a distribution. The display uses the actual values of the variable to present the shape of the distribution of data values. An outlier is an individual data value which lies far (above or below) from most or all of the other data values within a distribution.
 from most or all of the other data values within a distribution..")
6
EXAMPLE: Cholesterol Levels (expressed as milligrams of cholesterol per 100 milliliters of blood) 263, 258, 240, 233, 225, 222, 199, 282, 239, 236, 232, 283, 200, 212, 225, 235, 240, 258, 263, 274, 250, 259, 241, 237, 226, 213, 269, 199, 253, 201, 265, 226, 238, 242, 259, 233, 238, 229, 215, 202, 319, 277, 229, 239, 243, 248, 245, 219, 276, 246 To construct a stem-and-leaf display for the 50 cholesterol levels we will use the following procedure.
 263, 258, 240, 233, 225, 222, 199, 282, 239, 236, 232, 283, 200, 212, 225, 235, 240, 258, 263, 274, 250, 259, 241, 237, 226, 213, 269, 199, 253, 201, 265, 226, 238, 242, 259, 233, 238, 229, 215, 202, 319, 277, 229, 239, 243, 248, 245, 219, 276, 246 To construct a stem-and-leaf display for the 50 cholesterol levels we will use the following procedure.")
7
PROCEDURE TO CONSTRUCT A STEM-AND-LEAF DISPLAY Step 1 Identify the stem and leaf portion of your data values. Generally, the stem can have as many digits as needed to represent the beginning digit(s) of each data value. The leaf should only contain the last or terminating digit of the data values. Step 2 List each possible stem once, in a vertical column starting with the smallest stem on top and ending with the largest stem at the bottom. List even the stems with no corresponding leaves. Draw a vertical line to the right of the column of stems. Step 3 For each data value, record the leaf within the corresponding stem row and to the right of the vertical line. Step 4 Arrange the leaves within each stem row in increasing order from left to right. This provides a more informative stem-and-leaf display.
 of each data value. The leaf should only contain the last or terminating digit of the data values. Step 2 List each possible stem once, in a vertical column starting with the smallest stem on top and ending with the largest stem at the bottom. List even the stems with no corresponding leaves. Draw a vertical line to the right of the column of stems. Step 3 For each data value, record the leaf within the corresponding stem row and to the right of the vertical line. Step 4 Arrange the leaves within each stem row in increasing order from left to right. This provides a more informative stem-and-leaf display..")
8
HERE IT IS!

9
BACK-TO-BACK STEM- AND-LEAF DISPLAY A back-to-back stem-and-leaf display is constructed by writing one common stem for both displays. This common stem is placed between the leaves of both displays. This stem must contain all the possible stem values that can exist for both displays.

10
EXAMPLE OF BACK-TO-BACK STEM-AND–LEAF

13
CONSTRUCT BACK-TO-BACK STEAM-AND-LEAF

Similar presentations


;>")


