Download presentation
Presentation is loading. Please wait.

1
Learn Alberta - video http://www.learnalberta.ca/content/mesg/html/math6web/index.html?page=lessons&lesson=m6lessonshell08.swf (Unit 10) Review Expressions/Equations/Variables
 Review Expressions/Equations/Variables")
2
3 + 4 = 7 v + 4 = 7, what must v = s + 4, if s = 10 what is the answer? w – 12, if w = 20 what is the answer? b x 3, (b3, 3b) if b = 7 what is the answer? Y ÷ 6, ( y )if y = 30 what it the answer? 6 (Unit 10) Review Expressions/Equations/Variables
 if b = 7 what is the answer. Y ÷ 6, ( y )if y = 30 what it the answer. 6 (Unit 10) Review Expressions/Equations/Variables.")
3
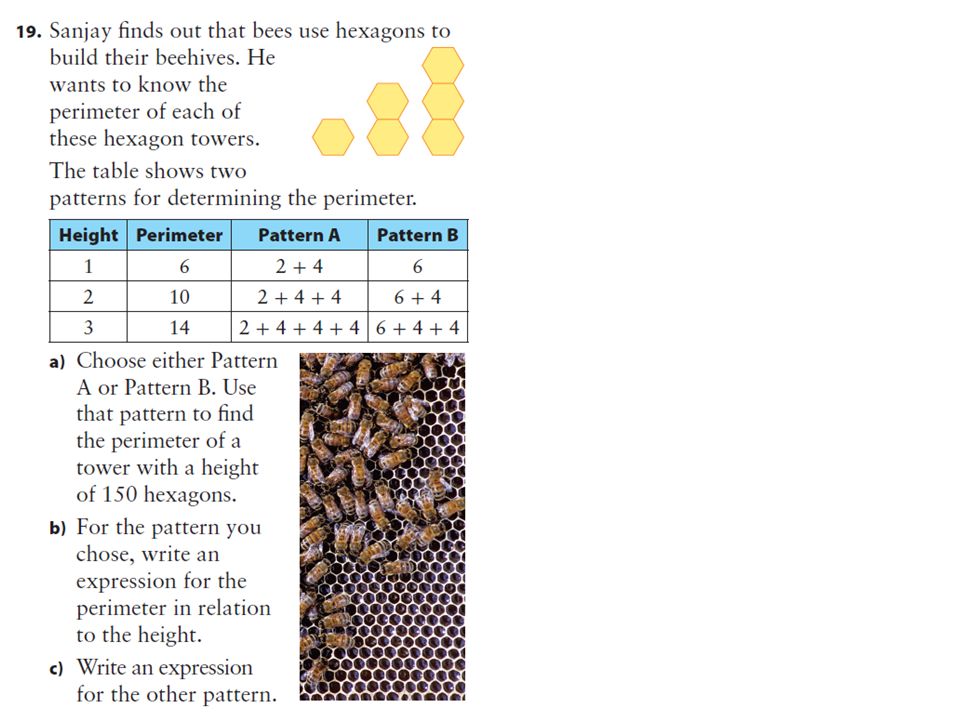
Patterns can be made of shapes, colours, number, letters, words and more. Some patterns are quite easy to describe. Others can be more difficult. Find the Pattern How many hexagons are in the next 3 diagrams? How will you do this? Describe Patterns (Unit 10) Student Outcome: Describe patterns using words, tables and diagrams.
 Student Outcome: Describe patterns using words, tables and diagrams..")
4
Patterns can be made of shapes, colours, number, letters, words and more. Some patterns are quite easy to describe. Others can be more difficult. Find the Pattern How many cubes are in the 4 th and 7 th shape? How will you do this? Describe Patterns (Unit 10) Student Outcome: Describe patterns using words, tables and diagrams.
 Student Outcome: Describe patterns using words, tables and diagrams..")
5
Patterns can be made of shapes, colours, number, letters, words and more. Some patterns are quite easy to describe. Others can be more difficult. Find the Pattern How many squares are in the 48 th diagram? How will you do this? Describe Patterns (Unit 10) Student Outcome: Describe patterns using words, tables and diagrams.
 Student Outcome: Describe patterns using words, tables and diagrams..")
6
Describe Patterns (Unit 10) Describe Patterns (Unit 10) Student Outcome: Describe patterns using words, tables and diagrams. 1.Make a T – Chart 2.Fill in chart 3. Pattern Rule Figure # Pattern (# of hexagons) 1 2 3 4 5 Figure 1Figure 2Figure 3
 Figure 1Figure 2Figure 3.")
7
Describe Patterns (Unit 10) Describe Patterns (Unit 10) Student Outcome: Describe patterns using words, tables and diagrams. 1.Make a T – Chart 2.Fill in chart 3. Pattern Rule Shape # Pattern (# cubes) 1 2 3 4 5
")
8
Pattern: an arrangement of shapes, colours, #’s, letters, words…etc, which you can predict what comes next. Create a T - chart which includes…Figure # and Pattern Describe Patterns of shapes… Figure #Pattern (# of Squares) 1 2 3 4 5
")
9
Use the chart to help describe the pattern in words… Hint: Use the figure #’s in your answer… Describe Patterns of shapes… Figure #Pattern (# of squares) 11 23 35 47 59 Using your description above…predict the number of squares in… (show your work) Figure # 7: Figure # 12:
 Using your description above…predict the number of squares in… (show your work) Figure # 7: Figure # 12:")
10
Find the pattern of “ninths” changed to decimals. Example: 1/9 = 0.111111111 repeated __ This can be changed to 0.1 called a repeating decimal Describe a Number Pattern… Student Outcome: Describe patterns with repeating decimals. Change the ninths below to repeating decimals! 2/9 = 5/9 = 8/9 = 3/9 =

11
What is the pattern of ninths? Describe a Number Pattern… Student Outcome: Describe patterns with repeating decimals. Answer: when you change the ninths to a decimal number, the numerator of the fraction becomes the digit used as a repeating decimal. Repeating Decimal: we use a bar notation to illustrate the a number has repeated one ore more times continuously.

12
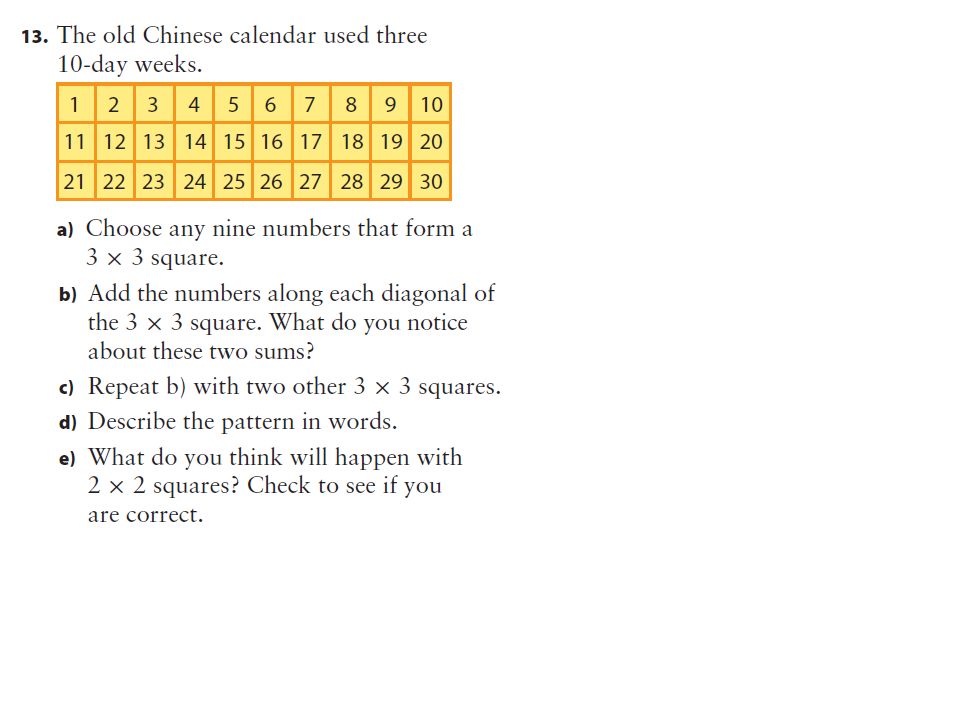
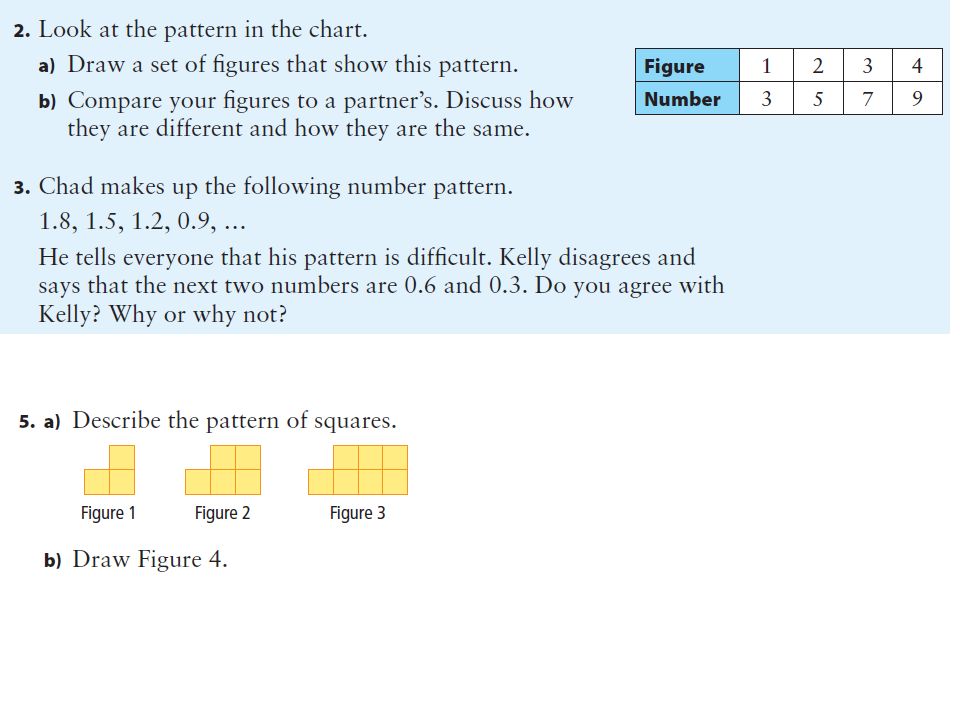
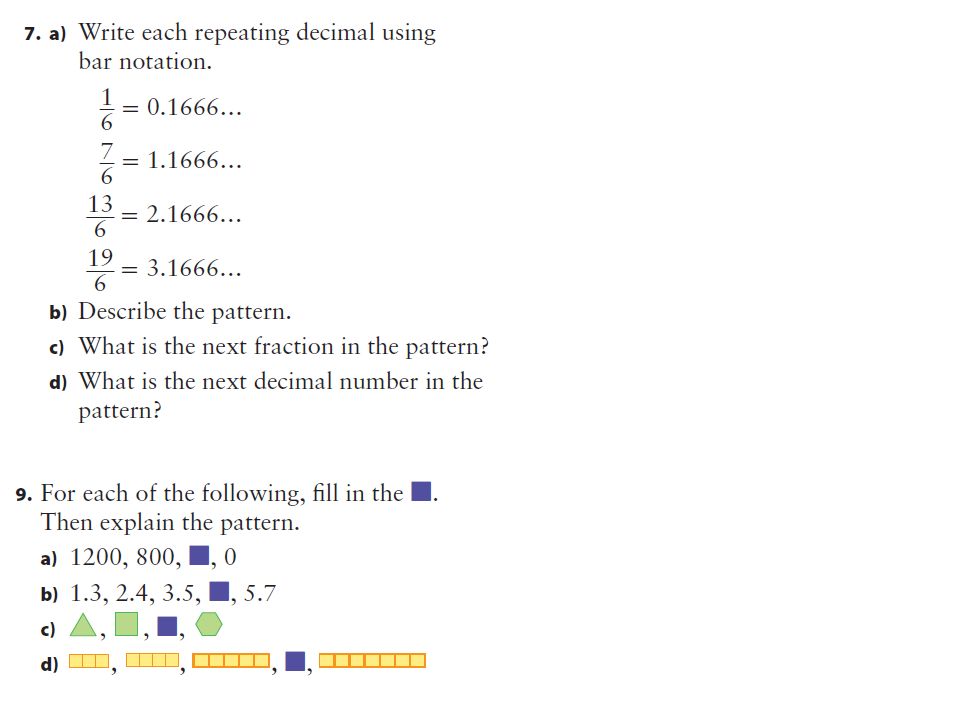
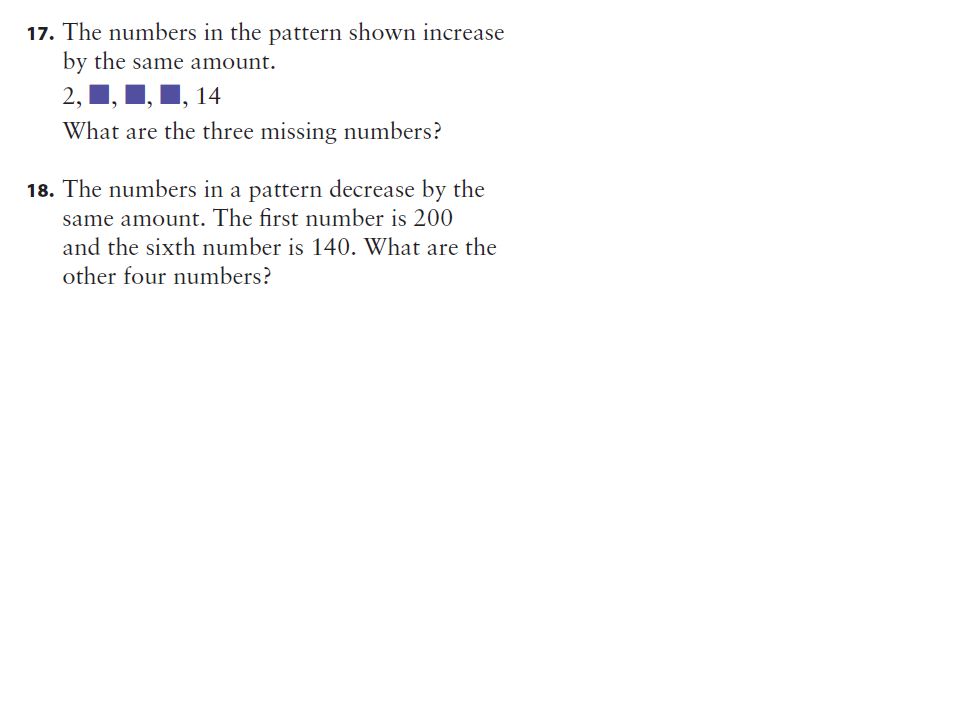
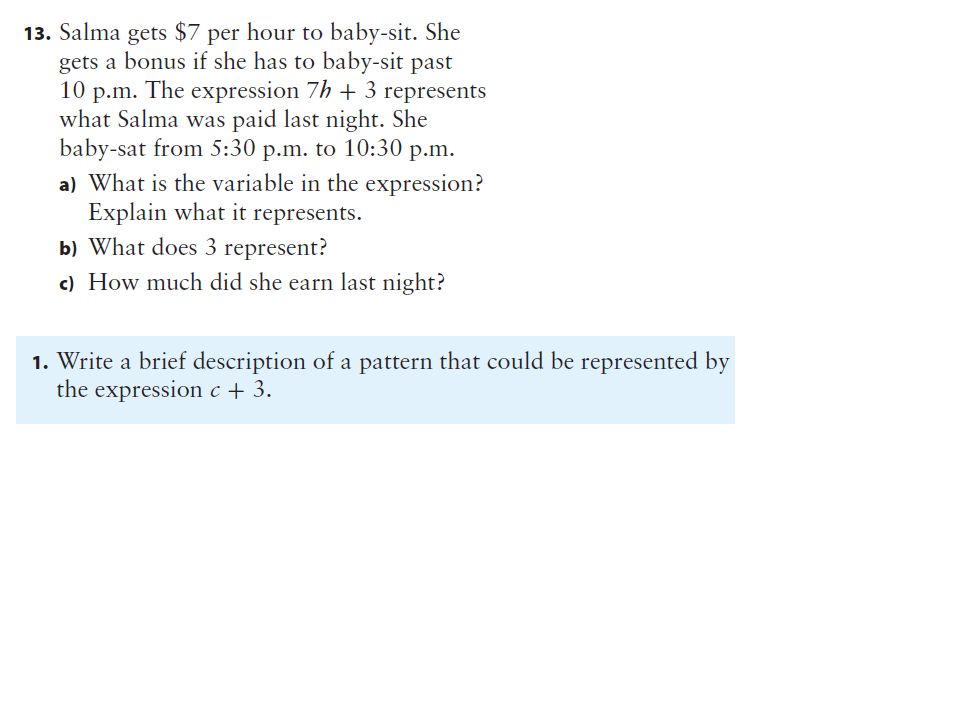
Describe Patterns of shapes & numbers… Page 354-357 3,12,17,18 13 a-d2a,3,9,12 2a,3,5,7,9

18
Show Me What You Know #1

19
Write the “expression” to represent the pattern… Exploring Variables & Expressions… Student Outcome: I can write an expression to represent a pattern. A kitchen floor is being covered with red & white tiles. 1.Try to figure our in “words” what the pattern(s) are…
 are….")
20
Write the “expression” to represent the pattern… Exploring Variables & Expressions… Student Outcome: I can write an expression to represent a pattern. A kitchen floor is being covered with red & white tiles. Create a chart for your information (to help find the expressions) Picture # 123459 White Tiles Red Tiles
 Picture # White Tiles Red Tiles.")
21
Write the “expression” to represent the pattern… Exploring Variables & Expressions… Student Outcome: I can write an expression to represent a pattern. Use your data to find expressions for patterns… Picture # 123459 White Tiles 4812 Red Tiles246 Red Tiles = W ÷ 2 or W/2 White Tiles =

22
Use your expression to “predict” the amount of red or white tiles for the examples below. Exploring Making Predictions… Student Outcome: I can write an expression to represent a pattern. 1.How many red tiles if there are… a. 10 white tiles? b. 22 white tiles? 2.How many white tiles if there are… a. 24 red tiles? b. 110 red tiles? Red Tiles = W ÷ 2 or W/2 White Tiles = 2 x R or 2R

23
Variable: a letter that represents an unknown number (x, a, b, etc…) Expression: a number or variable combined with an operation (+, -, x…) Value: a known or calculated amount Equation: a mathematical statement with 2 expressions ( = ) Constant: a number that does NOT change. It increases or decreases the value. Numerical Coefficient: a number that multiplies the variable. Describing patterns using EXPRESSIONS Student Outcome: Identify constant, numerical coefficient and variable. Label the “terms” above to the arrows in the example below… Learn Alberta http://www.learnalberta.ca/content/memg/index.html?term=Division02/Variable/index.html 3c x 4 = 36 Value Equation Constant Variable Expression Numerical Coefficient

24
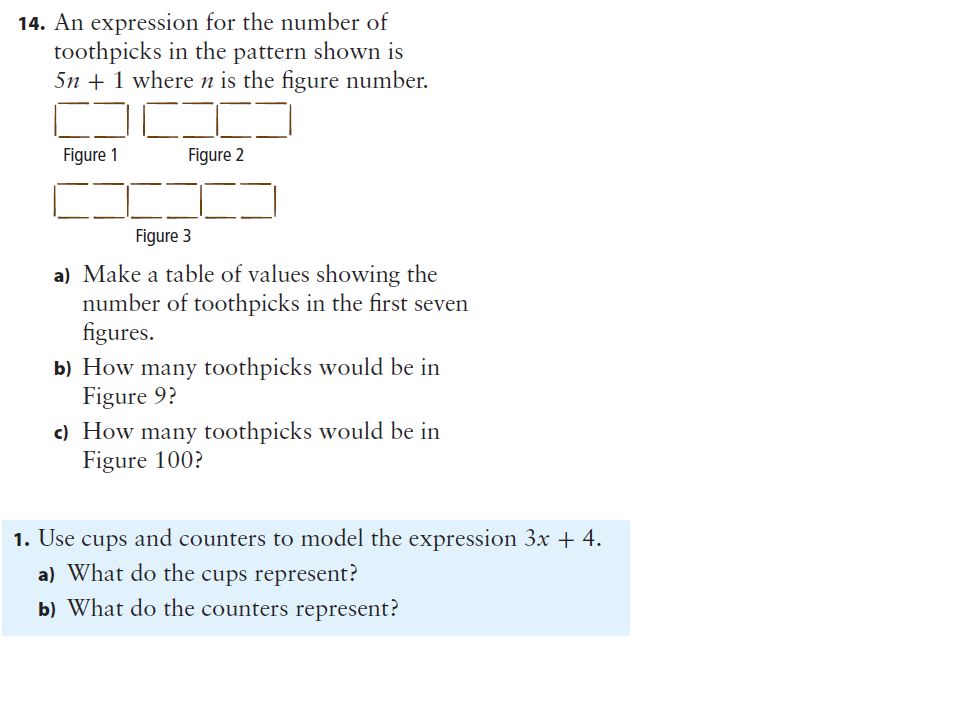
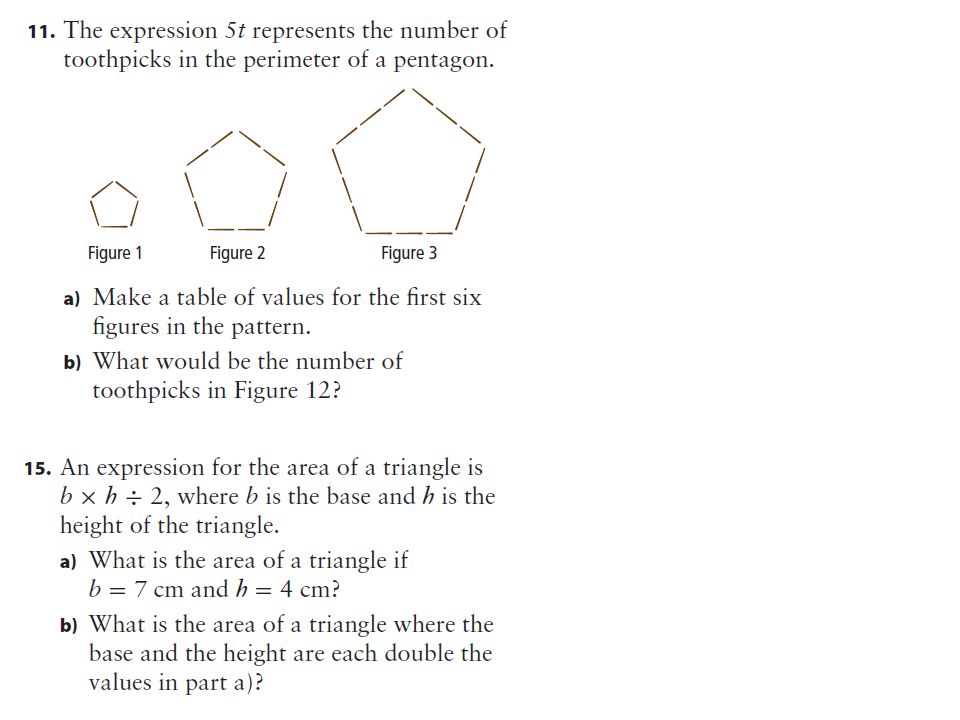
Use your knowledge of the terms to answer the questions below: 1.Everyday three employees work at the food bank with some volunteers. What is the variable, constant and expression for the statement above. 2. The following diagrams are made up of toothpicks. Find the expression for this pattern. How will you do this? Describing patterns using EXPRESSIONS Student Outcome: I can write an expression to represent a pattern.

25
1.Find the pattern(s)…put into words 2.Create a T-chart 3.Find an expression for the diagrams and number of toothpicks. 4.Predict the number of toothpicks for diagrams 10, 22 and 35. 5.Do you see another pattern? HINT “use the base” Can we create an expression based on the base and total number of toothpicks? Describing patterns using EXPRESSIONS Student Outcome: I can write an expression to represent a pattern.

26
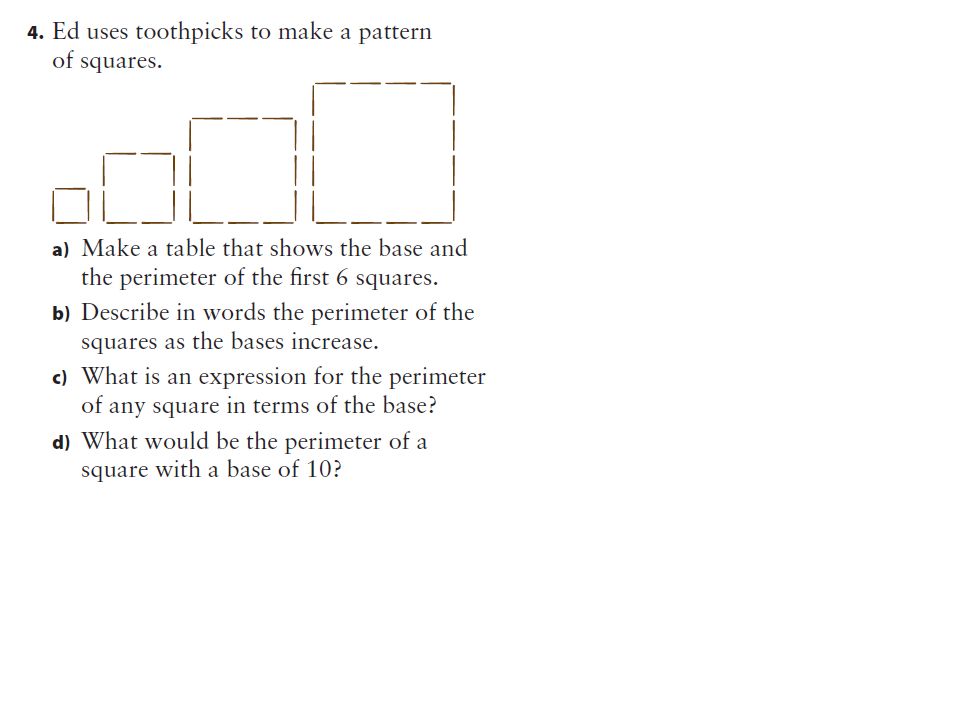
Complete #4 on page 361 (squares made from toothpicks)…you may work with a partner and discuss. 1.Find the pattern(s)…put into words 2.Create a T-chart 3.Find the expressions comparing the “base” and the “total number of toothpicks” 4.Predict the total number of toothpicks (perimeter) if the base is 10, 22 and 35? 5.Predict the # of toothpicks on the base if the perimeter is 40, 60, and 120? Describing patterns using EXPRESSIONS Student Outcome: I can write an expression to represent a pattern.
…put into words 2.Create a T-chart 3.Find the expressions comparing the base and the total number of toothpicks 4.Predict the total number of toothpicks (perimeter) if the base is 10, 22 and Predict the # of toothpicks on the base if the perimeter is 40, 60, and 120. Describing patterns using EXPRESSIONS Student Outcome: I can write an expression to represent a pattern..")
27
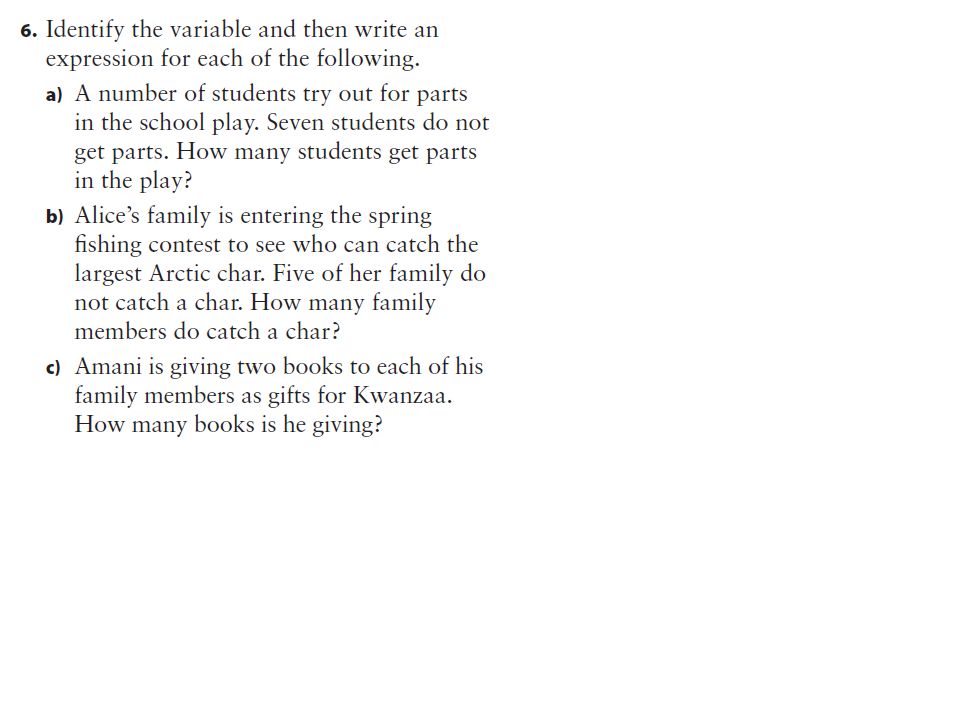
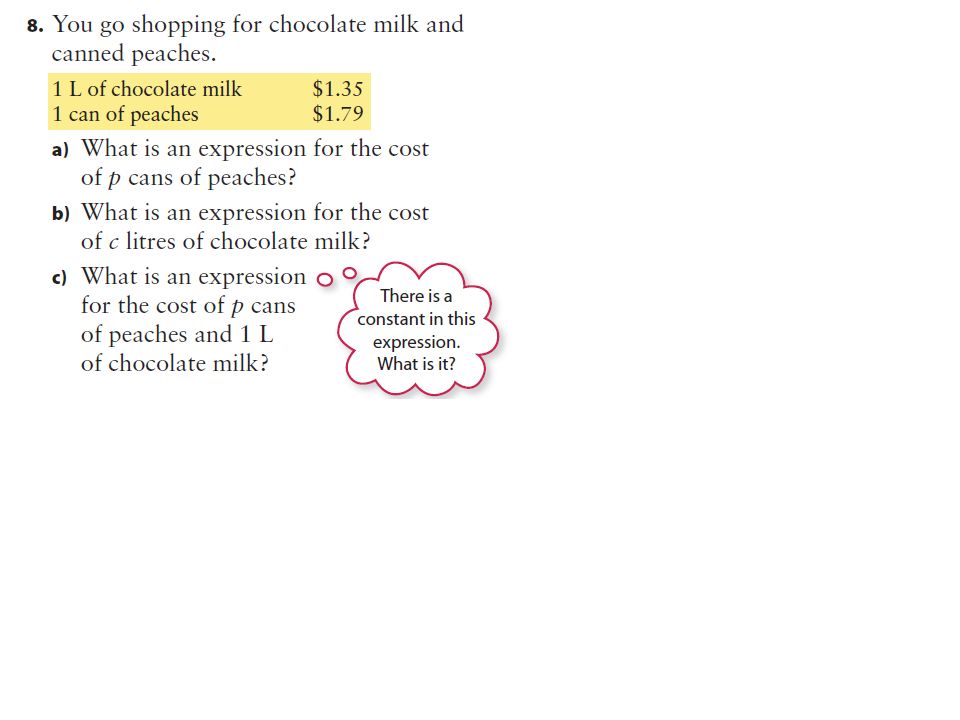
Finding Expressions for patterns… Page 361-364 1,12,14,17,19 13 1,6,11,12,15,16 1,4,6,8,11,12

37
Show Me What You Know #2

38
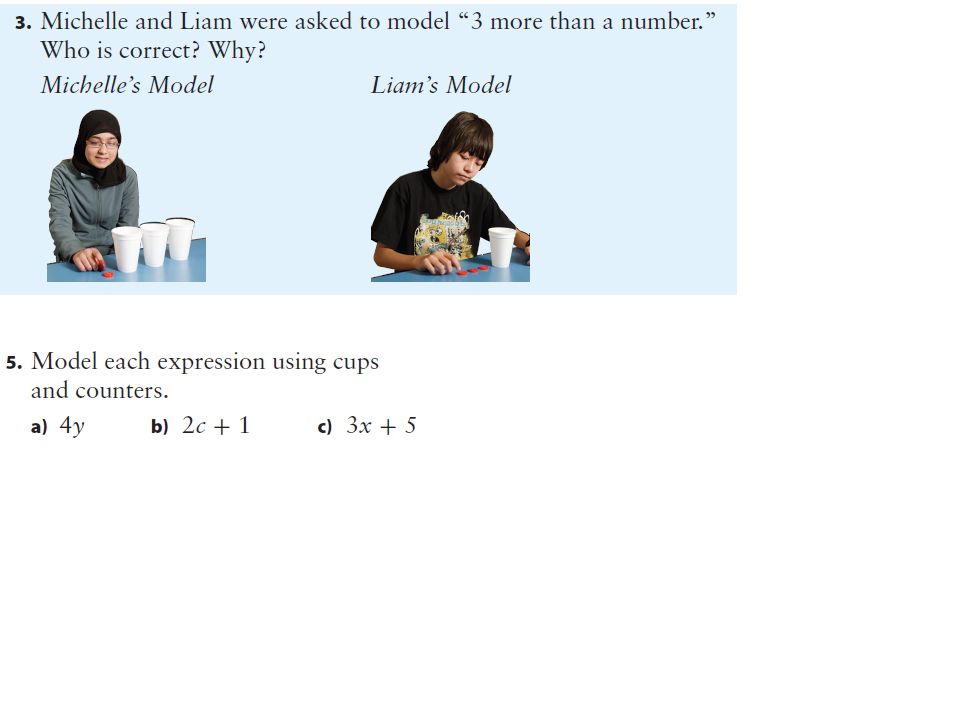
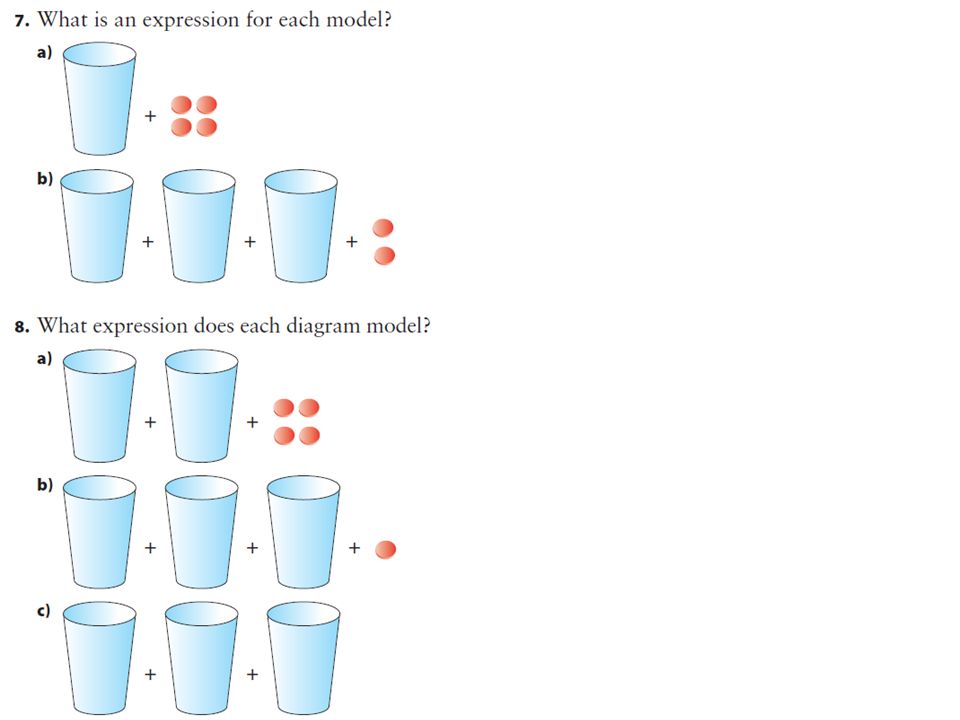
Evaluate Expressions … Student Outcome: I will be able to model an expression. Model an expression: draw a picture for an expression Let “c” represent the unknown number of pennies in the cup(s)…then add 4 more pennies. If you where to Place 6 pennies in the cup. Write the expression, draw a model for the expression, what is the value of “c” and find the value of the expression?
…then add 4 more pennies. If you where to Place 6 pennies in the cup. Write the expression, draw a model for the expression, what is the value of c and find the value of the expression .")
39
Evaluate Expressions … Evaluate Expressions … Student Outcome: I will be able to model an expression. Student Outcome I can make and solve equations with adding and subtracting c + 4c = 610 Let “c” represent the unknown number of pennies in the cup(s)…then add 4 more pennies. If you place 6 more pennies in the cup. Write the expression, what is the value of “c” and find the value of the expression? +
…then add 4 more pennies. If you place 6 more pennies in the cup. Write the expression, what is the value of c and find the value of the expression. +.")
40
Evaluate Expressions … Evaluate Expressions … Student Outcome: I will be able to model an expression. Student Outcome I can make and solve equations with adding and subtracting c + 4c = 610 Let “c” represent the unknown number of pennies in the cup…then add 4 more pennies. Place 6 more pennies in the cup. Write the expression, what is the value of “c” and find the value of the expression? +

41
Make a Table of Values… Student Outcome: Understand how to make a table of values for an expression. A table show two sets of related numbers. In your table have the picture # replace value of “n” and then complete the equation. For example… Figure # (n) Number of Squares (n + 2) 1(1) + 2 = 3 2(2) + 2) = 4 3(3) + 2 = 5 4(4) + 2 = 6
 Number of Squares (n + 2) 1(1) + 2 = 3 2(2) + 2) = 4 3(3) + 2 = 5 4(4) + 2 = 6.")
42
Make a Table of Values… Student Outcome: Understand how to make a table of values for an expression. Your Turn! In your table have the picture # replace value of “n” and then complete the equation. For example… Figure # (n) Number of Triangles (2n -1) 1 2 3 5 7
 Number of Triangles (2n -1)")
43
Show Me What You Know #3 Use the model below to complete the following… 1.What is the expression? 2.Show a “table of values” from 0-5 as your variables. 3.How many pennies in the 13 th picture? Show Work! 4.What is the expression to find the picture #? 5.What is the picture # of 77 pennies? Show Work!

44
Evaluate & Formulate Tables… Page 368-371 1,3,16,19,21 14 1,3,8,10,15,18 1,3,5c,7,9,11

54
Linear Relation: a pattern made by two sets of numbers that results in points along a straight line (pattern) on a coordinate grid. Graph Linear Relations … Student Outcome: I will be able to graph a linear relation. 1.What can we do to make the data on the grid make more sense? 2.What is the pattern? 3.What is the “expression?”

55
Take the data from the chart and complete the following… 1.Find the Expression(s) using the first 3 sets of data. 2.Complete the rest of the chart. 3.Then Label the data onto a coordinate grid. Remember, the 1 st number of the coordinates is always the x-axis! Plot Points From a Given Data… Student Outcome: I will be able to graph a linear relation. Number of Pups, “p”Number of Fish, “f”Ordered Pair (p, f) 13(1, 3) 26 39 7 10
 13(1, 3)")
56
Plot Points From a Given Data… Number of Pups, “p” Number of Fish, “f” Ordered Pair (p, f) 13(1, 3) 26(2, 6) 39(3, 9) 721(7, 21) 1030(10, 30) 1.What is the pattern? 2.What is the expression to find “p” 3.What is the expression to find “f”

57
Plot Points From a Given Data… Number of Pups “p” N U M B E R of F I S H ”f” Number of Pups, “p” Number of Fish, “f” Ordered Pair (p, f) 13(1, 3) 26(2, 6) 39(3, 9) 721(7, 21) 1030(10, 30)
 13(1, 3) 26(2, 6) 39(3, 9) 721(7, 21) 1030(10, 30)")
58
Describe a Graph to Solve a Problem Armand is four years old. His allowance starts at $2 per week. Each year he will get a $1 per week increase. The graph shows what his total allowance will be after the increase each year.

59
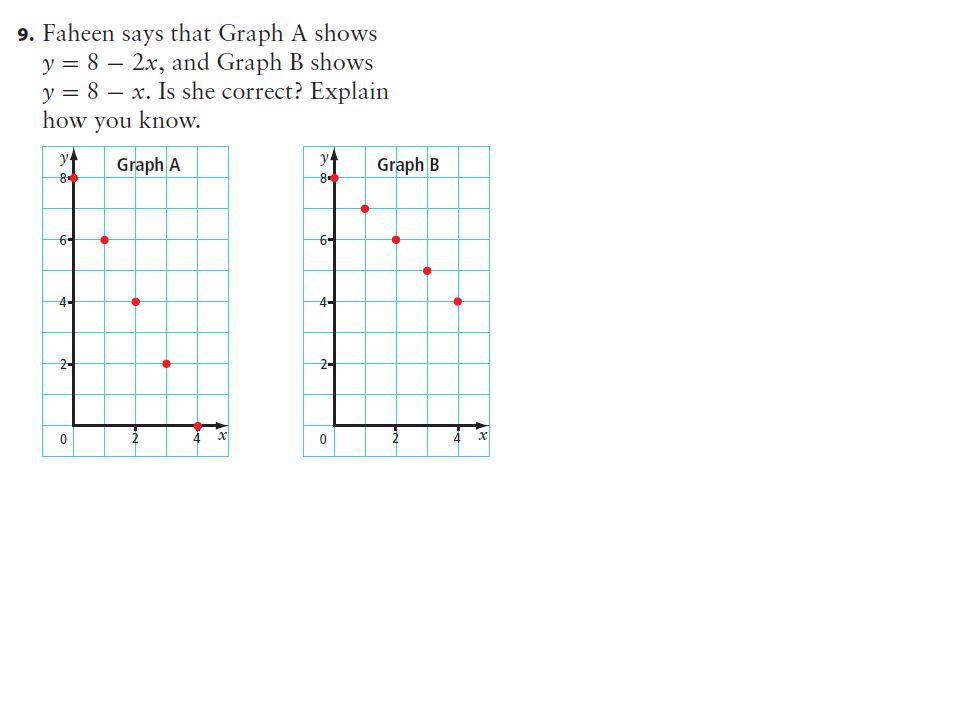
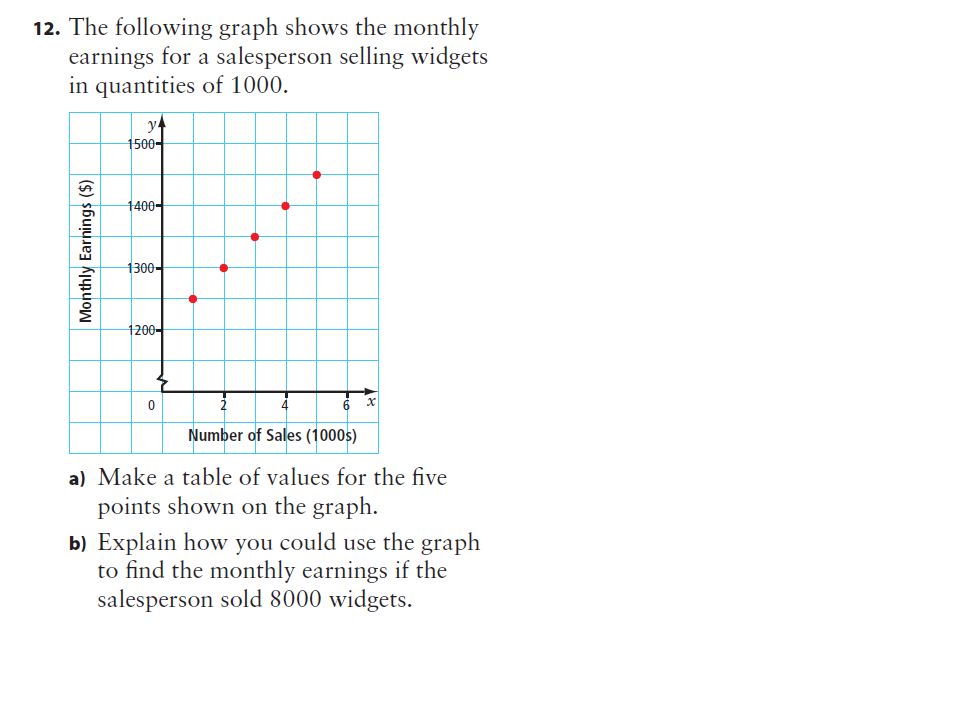
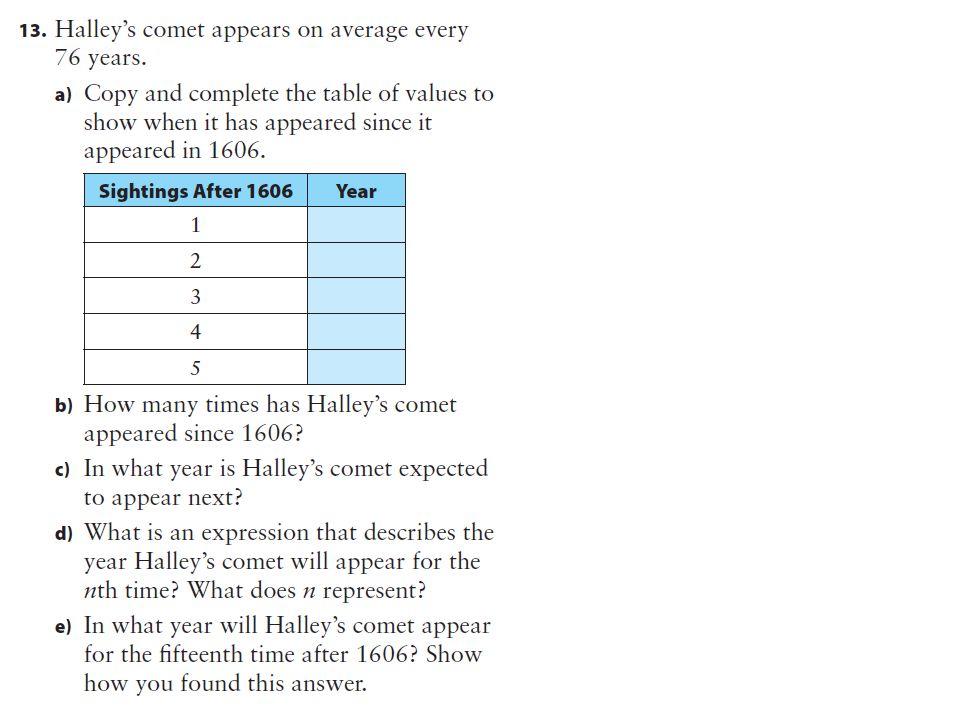
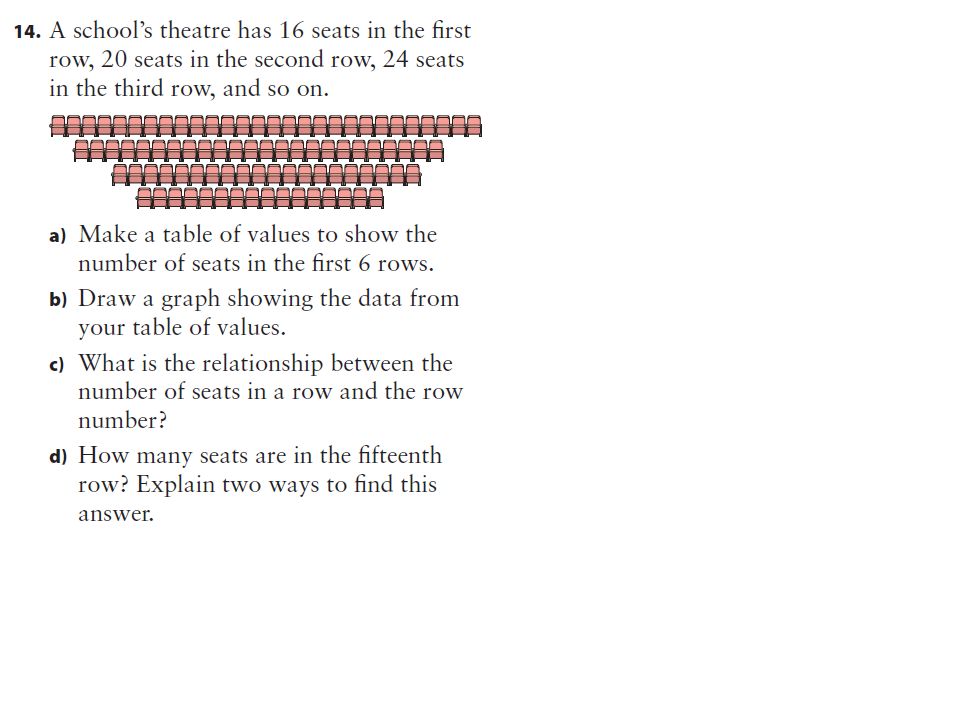
Plot, Analyze and Find Expressions Page 378-381 2,12,13,14,15 10 2,3,7,9,12,13 2,3,5,7,8,9

69
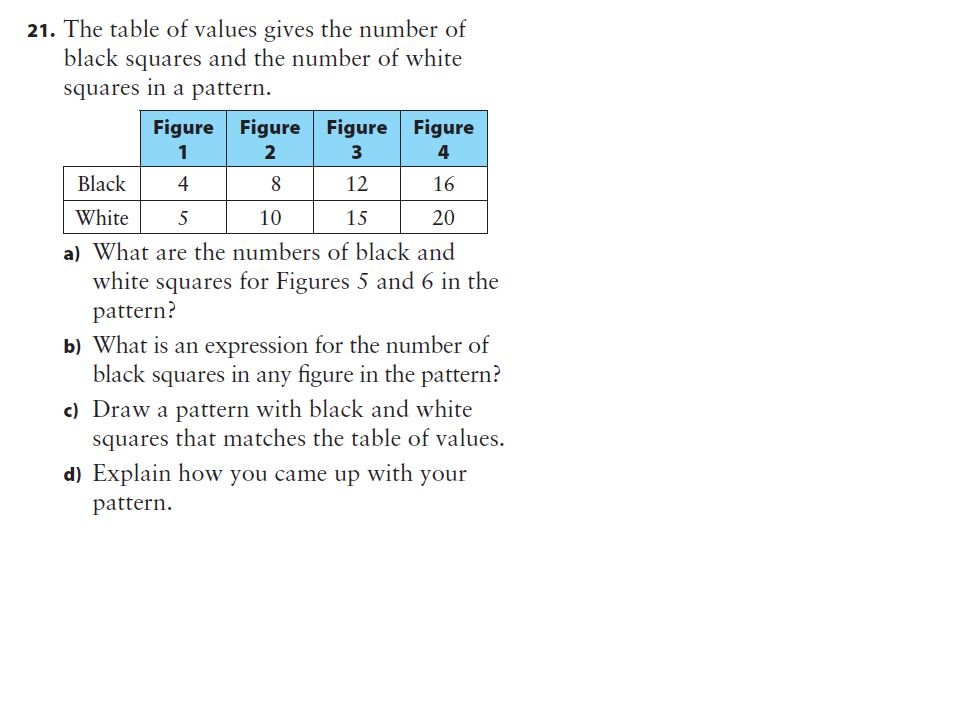
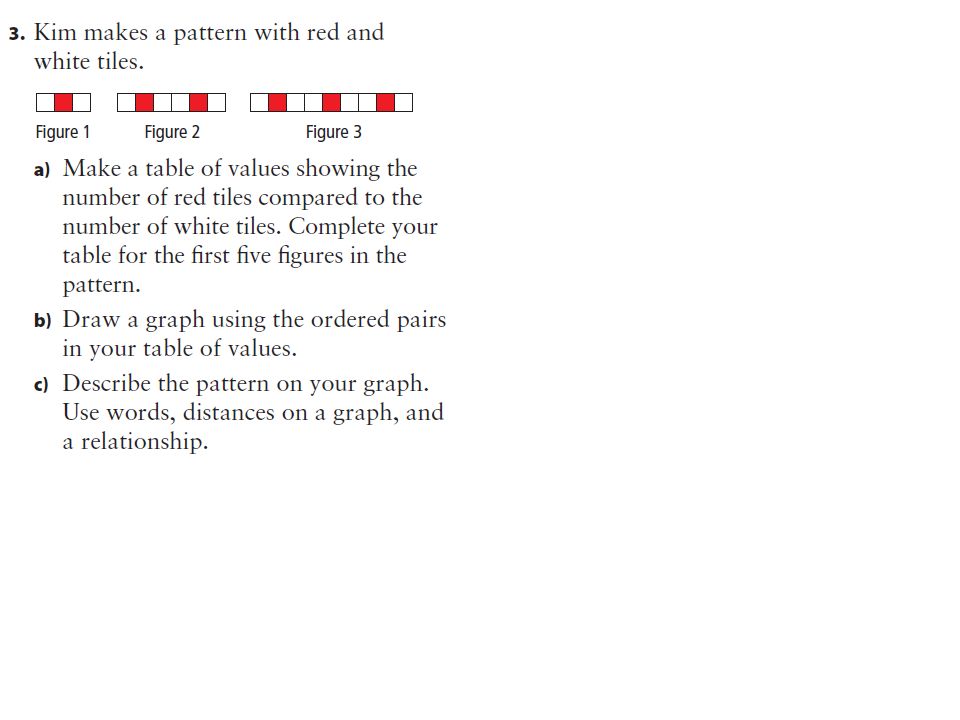
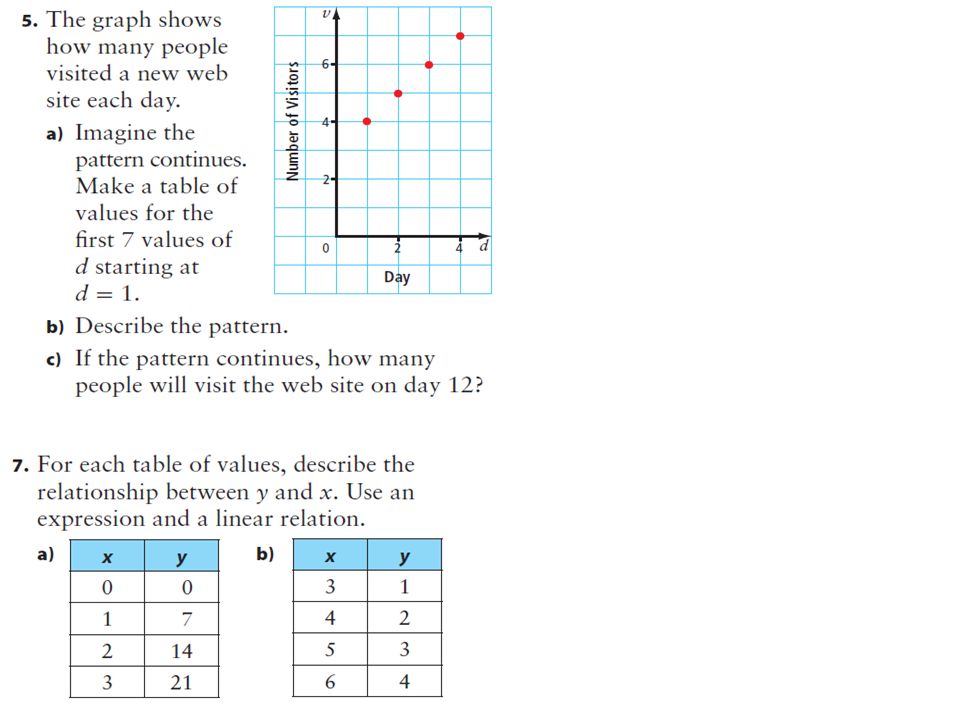
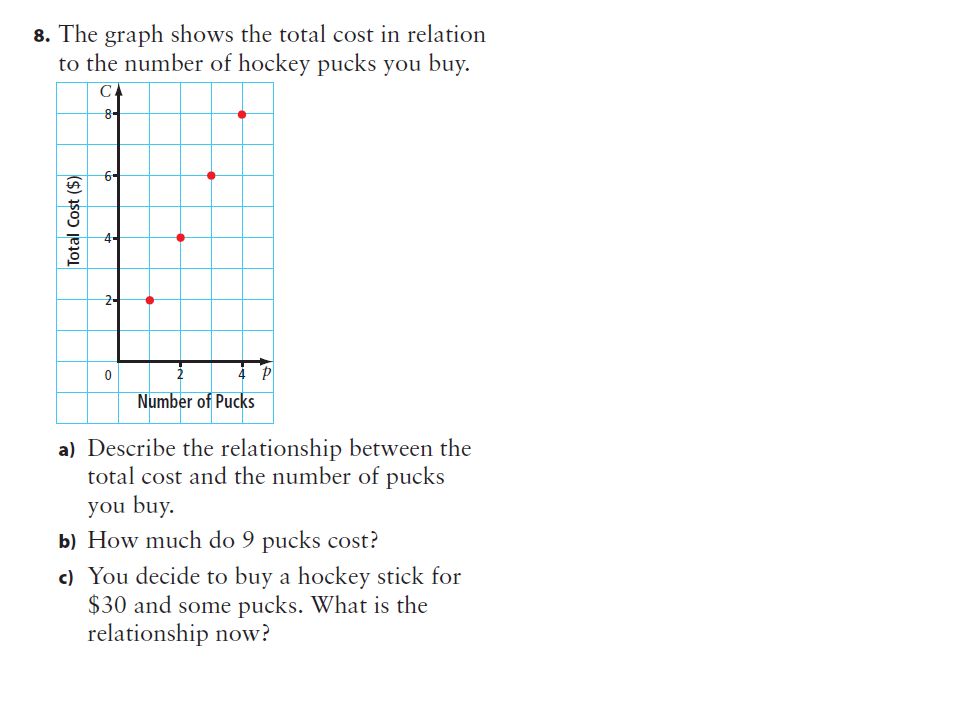
Chapter Review– Page 384-385 Complete Questions 1 - 8

Similar presentations


>")


