Download presentation
Presentation is loading. Please wait.

1
RAISEonline 2011 1 David Robinson & Martin Kaliszewski

2
RAISEonline 2011 David Value Added –Context –Pupil groups –English Baccalaureate –Other changes Martin Other RAISEonline changes –Website refresh –Expected progress reporting –Context reporting –P scales (KS1 & 2) –New KS4 attainment indicators
 –New KS4 attainment indicators")
3
KS2-4 Value Added – what’s changed? No- Context (pupil or school) Only- Prior (KS2) attainment Still - Best 8 (or equivalencies) + English and Maths Model otherwise similar –Multi-level modelling –Subject deviation terms –Except new cubic term (KS2APS 3 ) VAC
 Only- Prior (KS2) attainment Still - Best 8 (or equivalencies) + English and Maths Model otherwise similar –Multi-level modelling –Subject deviation terms –Except new cubic term (KS2APS 3 ) VAC.")
4
No- Context (pupil or school) Only- Prior (KS1) attainment Still - KS2 Average point score Model otherwise similar –Multi-level modelling –Subject deviation terms –Except new cubic term (KS1APS 3 ) KS1-2 Value Added – what’s changed? VA

5
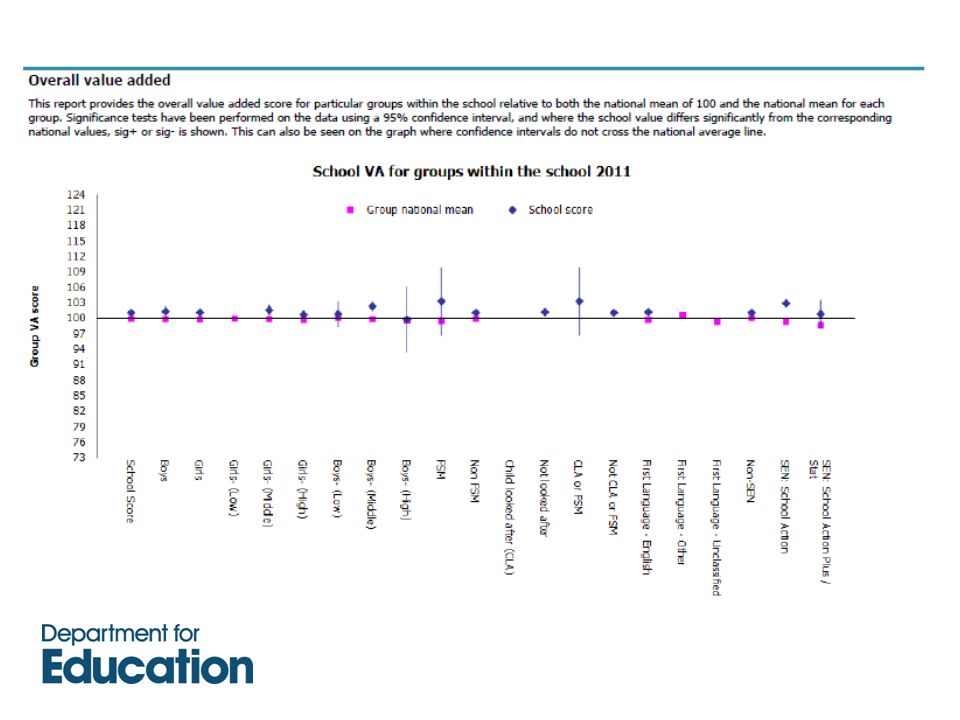
So does that mean no context? Sig + Not sig Sig + Not sig All pupils (1000) - Pupil group - N/A Not sig
 - Pupil group - N/A Not sig.")
7
Pupil Value Added scatter plots are shown by groups

8
New - English Baccalaureate Value Added 5 separate measures - English, Mathematics, Science, Humanity, Language Pupils scores relate to number of points (1/6 of a grade) above/below national average Use KS2 English and Maths as prior attainment
 above/below national average Use KS2 English and Maths as prior attainment")
9
Value Added – what else has changed? Calculated twice Unamended (unvalidated) data 22 Nov 2011 – Release of KS2-4 data in RAISEonline Amended (validated) data Jan 2012 – Updated KS2-4 data in RAISEonline and Performance Tables published All schools scores will change Even schools with no change in their results! As VA scores are relative to each other e.g. One school score goes up the other 6,000 schools go down (very slightly)
 data 22 Nov 2011 – Release of KS2-4 data in RAISEonline Amended (validated) data Jan 2012 – Updated KS2-4 data in RAISEonline and Performance Tables published All schools scores will change Even schools with no change in their results. As VA scores are relative to each other e.g. One school score goes up the other 6,000 schools go down (very slightly).")
10
Value Added – what else has changed? No separate special schools model Pupils in special schools will be compared pupils with the same prior attainment in mainstream schools Teacher assessment data used for KS2 For pupils working below the level of the test TA data used to differentiate between pupils at Level 2, Level 1 and below Level 1

11
KS2 Teacher assessments This methodology is used for all Value Added and Expected Progress measures

12
Transition matricies All pupils for the first time Improved presentation Available in RAISEonline document library

13
New look to the website coincides with the most significant set of changes to the reporting since 2005

14
The “full” report has now been more correctly named as the “summary” report. It has also got a lot longer!

15
Expected Progress Reporting A new high level report is available with national figures

16
Expected Progress KS1-2 National figures are now included in the Expected Progress reports

17
Expected Progress KS2-4 This will be the format of the KS2 to 4 Expected Progress reports. Sublevels will be available through the interactive drop down menu.

18
Basic Characteristics

19
Ethnicity

20
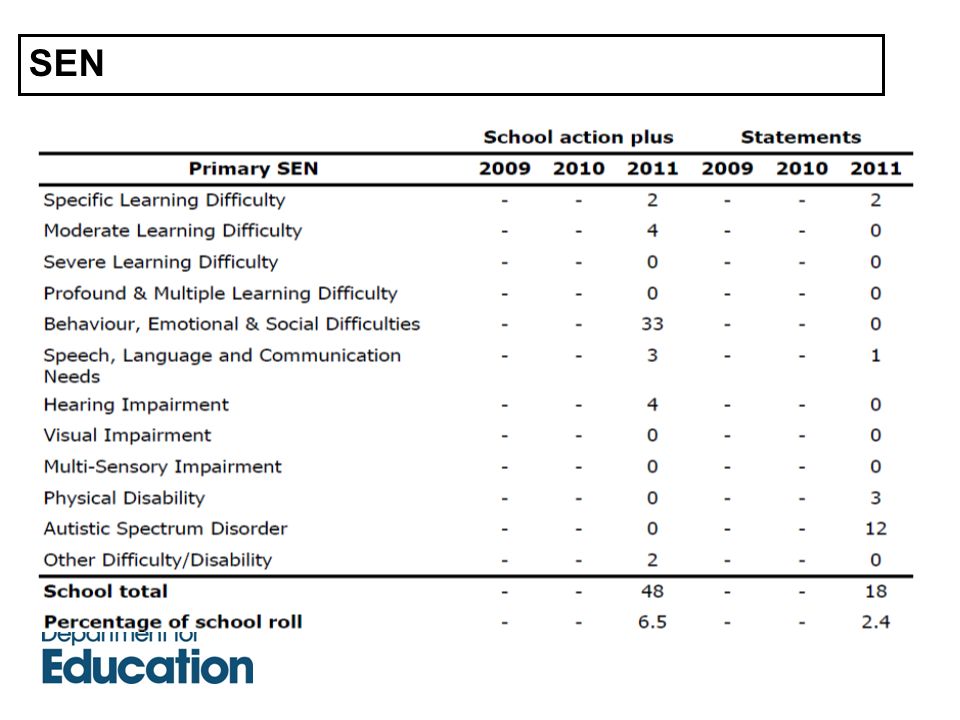
SEN

22
Prior attainment (primary)
")
23
Prior attainment (secondary)
")
24
KS1 P scale reports Reading, writing and mathematics are displayed

25
KS2 P scale reports English and mathematics are displayed

26
Ebacc and Basics - by pupil group and subject area Usual pupil groups (e.g. ethnicity, SEN etc.) Other Ebacc Subjects
 Other Ebacc Subjects.")
27
Thresholds

28
Questions or comments? Further information on changes in RAISEonline document library

Similar presentations


 and Office of Standards in Education (Ofsted) web based school performance analysis tool. It.>")

 to improve effectiveness John Mc Cann Assistant Director of Schools Diocese of Shrewsbury Department.>")


 Cornwall Council.>")
>")


