Download presentation
Presentation is loading. Please wait.

1
PSYA4 RESEARCH METHODS Revision and exam practice

2
Specification

3
Question format The research methods section of the PSYA4 paper is worth 35 marks, meaning that it is worth more than a third of the paper (the other two sections are 25 marks each). Questions will be mostly short answer (from 1 to 4 marks) but there is also likely to be a longer question (10-12 marks) that involves designing a study and writing a section of a report (methods and results have appeared so far).
 but there is also likely to be a longer question (10-12 marks) that involves designing a study and writing a section of a report (methods and results have appeared so far)..")
4
The link with AS research methods The A2 specification BUILDS ON your previous AS knowledge so it is essential that you know BOTH the AS and the A2 material EQUALLY WELL. So, for example, you could be asked about how to operationalise variables or identify extraneous variables, even though these are not named on the A2 research methods specification. Therefore, you should use the A2 specification in conjunction with the AS one, to ensure you are fully prepared!

5
AS

6
Example questions drawing on AS research methods JAN 2012 Read the question stem and answer these questions using your bank of past questions. 1 7 Write a suitable directional hypothesis for this investigation. (3 marks) 2 5 In this case, the psychologists decided to use a laboratory experiment rather than a field experiment. Discuss advantages of carrying out this experiment in a laboratory. (4 marks)
 2 5 In this case, the psychologists decided to use a laboratory experiment rather than a field experiment. Discuss advantages of carrying out this experiment in a laboratory. (4 marks).")
7
Jan 2012 Q17/25 Examiner’s report

8
The major features of science Science (from Latin scientia, meaning "knowledge") is a branch of knowledge gained from careful and systematic investigation which is used to predict general laws. Psychology follows the principles of other sciences, such as biology and chemistry. These include: –Replicability –Objectivity –Theory construction –Hypothesis testing –The use of empirical methods These features are named on the specification so you could be asked a question specifically about each one.

9
Replicability If we can carry out research again at another time and find the same or similar findings, we can say that our findings are replicable. This is why it is important that our method is carefully controlled and reported (including operationalisation of variables in an experiment). It is only by replicating research that we can be sure that our findings are valid and reliable.
. It is only by replicating research that we can be sure that our findings are valid and reliable..")
10
Objectivity Scientists strive to be objective in their observations and measurements. This means that they try not to let their own opinions and expectations affect what they record. This is important because it means that the experiment should get the same result regardless of who it is carried out by.

11
Theory construction Theories are constructed using the scientific process. Hypotheses are developed based on observation of phenomena. These hypotheses are then rigorously tested. A hypothesis that is consistently supported leads to the development of a theory. Observation Develop hypothesis Test hypothesis Hypothesis is supported Hypothesis is not supported Develop theory Develop new hypothesis

12
Hypothesis testing The scientific method progresses by hypothesis testing. Our hypothesis might be that people are happier in the summer. We must then do our best to test this hypothesis. We must try everything we can to disprove (falsify) our hypothesis. If we cannot find evidence to do this, we can accept our hypothesis.
 our hypothesis. If we cannot find evidence to do this, we can accept our hypothesis..")
13
The use of empirical methods The word empirical means information gained by experience, observation, or experiment. The central theme in the scientific method is that all evidence must be empirical which means it is based on evidence.

14
OVER TO YOU JANUARY 2011 Read the question stem 1 9 Explain why the teacher’s personal opinion cannot be accepted as scientific evidence. Refer to some of the major features of science in your answer. (6 marks) Remember that this is an application question so you MUST make reference to the question stem in the answer.
 Remember that this is an application question so you MUST make reference to the question stem in the answer..")
15
Jan 2011 Q19 mark scheme

16
Jan 2011 Q19 examiner’s report

17
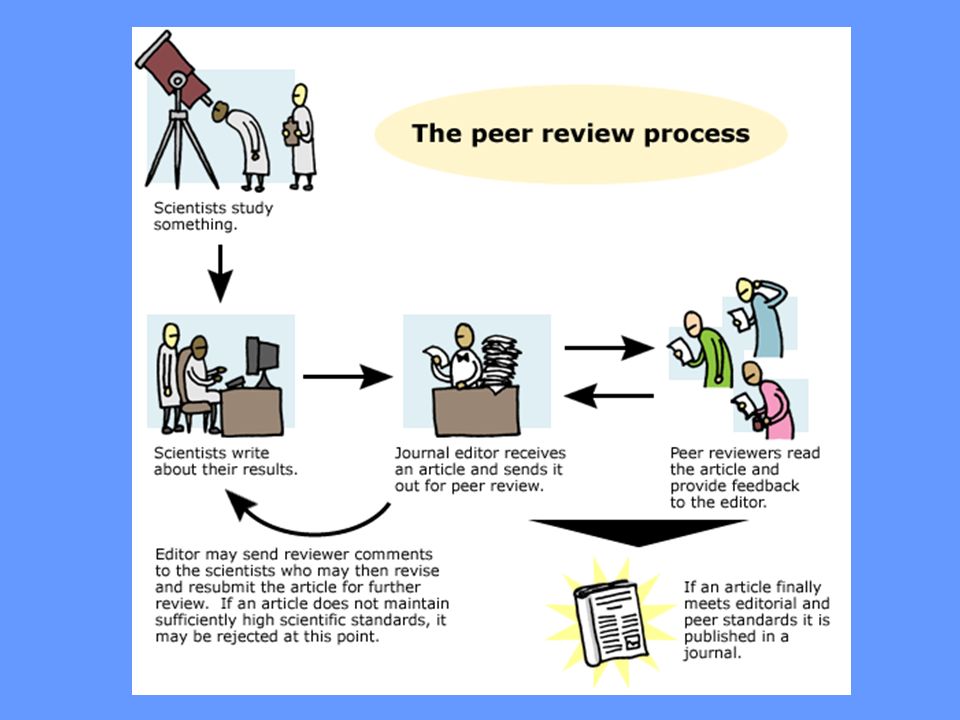
Validating new knowledge and the role of peer review Peer review is the assessment of scientific work by others who are experts in the field. The intention of peer reviewing is to ensure that any research conducted and published is of high quality. This ensures that the integrity of the discipline is protected. In other words, it means that psychology is respected and taken seriously because the research published is scientifically conducted and of high quality.

19
Peer review The reviewer will assess the research in terms of: –The appropriateness of the research design –The originality of the research –Any ethical issues –The sampling technique used and the representativeness of the sample –Any potential sources of bias –The operationalisation of variables –The reliability and validity of the findings –The appropriateness of the conclusions drawn

20
Problems with peer review Unachievable ideal – it isn’t always possible to find an appropriate expert to review a research proposal or report. This means that poor research may be passed because the reviewer didn’t really understand it. Publication bias – peer review tends to favour the publication of positive results, possibly because editors want research that has important implications in order to increase the standing of their journal. Biased reviewers – as the research is in the reviewers area of expertise, it may cite the reviewer’s own work. This could mean that they are less likely to approve work that does not agree with their own. Preserving the status quo – peer review results in a preference for work that fits in with existing theories rather than dissenting or unconventional ideas. This could be one of the elements that slows down change in scientific theories.

21
OVER TO YOU JUNE 2010 1 8 Outline what is meant by the term peer review in psychological research. (2 marks) 1 9 Explain why peer review is important in psychological research. (5 marks)
 1 9 Explain why peer review is important in psychological research. (5 marks).")
22
June 2010 Q18 mark scheme

23
June 2010 Q18 examiner’s report

24
June 2010 Q19 mark scheme

25
Q19 examiner’s report

26
Selection and application of appropriate research methods This section of the specification draws heavily on what you have learned at AS. However, the main difference is that at A2 you will asked to design your own research rather than learn about and evaluate the research carried out by other psychologists. Therefore, you must be able to select appropriate methods for the research scenario given. For example, you should be able to explain why an interview might be more suitable for a certain scenario than a questionnaire.

27
Research methods When a question talks about a research method, it will mean one of the following: –Experiments – laboratory, field or natural –Correlational analysis –Observational techniques –Self report techniques – questionnaires and interviews –Case studies Refer to the printout provided for a full recap of all AS research methods.

28
OVER TO YOU JANUARY 2012 2 7 Research has shown that music can affect the ability to concentrate. Design an experiment that could be carried out in a classroom to test the effects of two different kinds of music on a task requiring concentration (e.g. word search). You must use a repeated measures design. In your answer you should: –fully operationalise the independent and dependent variables –provide details of how you would control extraneous variables –describe the procedure that you would use. You should provide sufficient detail for the study to be carried out. (10 marks)
. You must use a repeated measures design. In your answer you should: –fully operationalise the independent and dependent variables –provide details of how you would control extraneous variables –describe the procedure that you would use. You should provide sufficient detail for the study to be carried out. (10 marks).")
29
Jan 2012 Q27 mark scheme

31
Jan 2012 Q27 Examiner’s report

32
Implications of sampling strategies, for example, bias and generalising There are three sampling strategies named on the specification; random, opportunity and volunteer. You need to be able to discuss the advantages and disadvantages of each, including issues of bias and how this affects the ability to generalise the findings.

33
Key sampling concepts The population (or target population) refers to all the people about whom a researcher wishes to make a statement. This aims is to select a representative sample from this target population – a small group who represent the target population in terms of characteristics such as age, IQ, social class, relevant experiences and so on. The importance of representativeness is the ability to generalise from the sample to the target population. A sample that is not representative is described as biased i.e. leaning in one direction.

34
Opportunity sample Participants are selected using those people who are most easily available. This is the easiest and cheapest method to use, but it is inevitably biased because the sample is drawn from a small part of the target population. For example, if you selected your sample from people walking around the centre of a town on a Monday morning, it would be unlikely to include professional people (because they are at work).
..")
35
Volunteer sample Participants are selected by asking for volunteers. For example, placing an advertisement on a college notice board. This method can access a variety of participants if the advertisement is, for example, in a national newspaper, which could make the sample representative. However, such samples are inevitably biased because participants are highly motivated and/or with time on their hands.

36
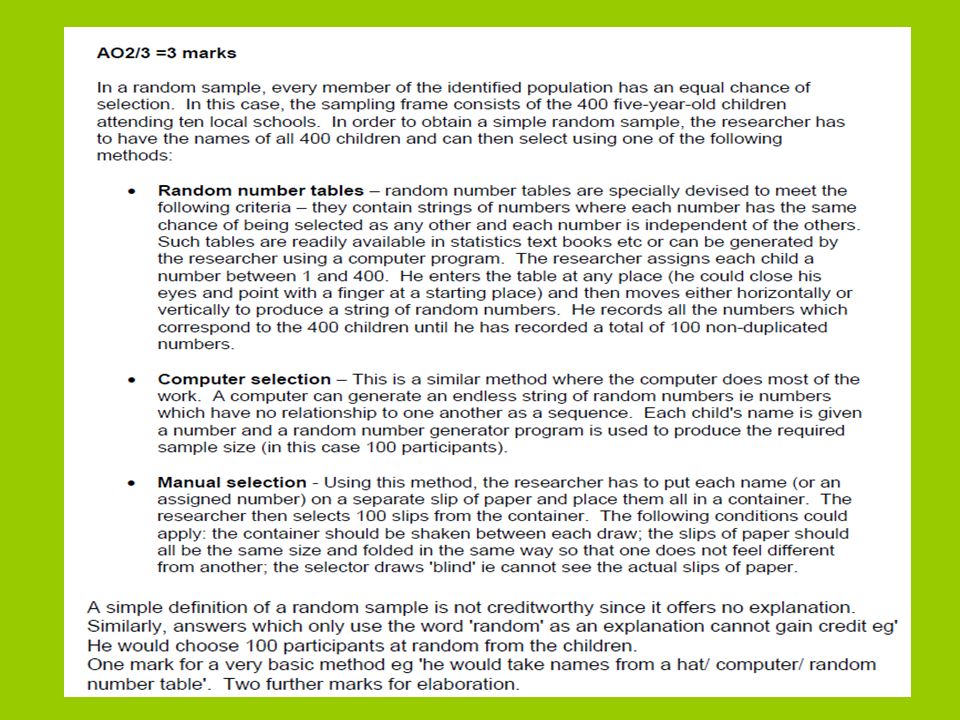
Random sample Participants are selected using a random number technique. First, all members of the target population are identified (e.g. all the members of one schools or all the members of a town) and then individuals are selected either by the lottery methods (numbers chosen from a hat) or a random number generator. This method is potentially unbiased because all members of the target population have an equal chance of selection, though in the end a researcher may still end up with a biased sample because some people refuse to take part.
 and then individuals are selected either by the lottery methods (numbers chosen from a hat) or a random number generator. This method is potentially unbiased because all members of the target population have an equal chance of selection, though in the end a researcher may still end up with a biased sample because some people refuse to take part..")
37
OVER TO YOU JANUARY 2011 Read the question stem 2 0 The psychologist used a random sampling method. Explain how he could have obtained his sample using this method. (3 marks) 2 1 Explain limitations of using random sampling in this study. (3 marks)
 2 1 Explain limitations of using random sampling in this study. (3 marks).")
39
Q21 mark scheme

40
Q20 and 21 examiner’s report

41
Types of reliability Reliability refers to how consistent a study or measuring device is. A measurement is said to be reliable or consistent if the measurement can produce similar results if used again in similar circumstances. –Internal reliability - Internal reliability refers to the extent to which a measure is consistent within itself (e.g. whether all questions on a questionnaire are measuring the same thing). –External reliability - External reliability refers to the extent to which a measure varies from one use to another. –Inter rater reliability –The extent to which two or more raters agree.
. –External reliability - External reliability refers to the extent to which a measure varies from one use to another. –Inter rater reliability –The extent to which two or more raters agree..")
42
Assessment of reliability Test retest – repeat the test on different occasions to see if it produces the same results. Split half – split the instrument in half (e.g. a questionnaire) and compare the two halves to see if results are similar. Inter rater – a statistical test (Spearmans) can be used to check the degree of agreement (correlation) between raters.
 and compare the two halves to see if results are similar. Inter rater – a statistical test (Spearmans) can be used to check the degree of agreement (correlation) between raters..")
43
Improving reliability Improving internal reliability – the researcher can remove items (e.g. questions on a questionnaire) individually until the unreliable items are identified. Improving external reliability – individual aspects of the study can be checked to identify the unreliable factors e.g. if the same instructions were given to participants each time the research was repeated. Improving inter rater reliability – ensure that clear behavioural categories are identified, and that all observers are fully trained on how to apply them.
 individually until the unreliable items are identified. Improving external reliability – individual aspects of the study can be checked to identify the unreliable factors e.g. if the same instructions were given to participants each time the research was repeated. Improving inter rater reliability – ensure that clear behavioural categories are identified, and that all observers are fully trained on how to apply them..")
44
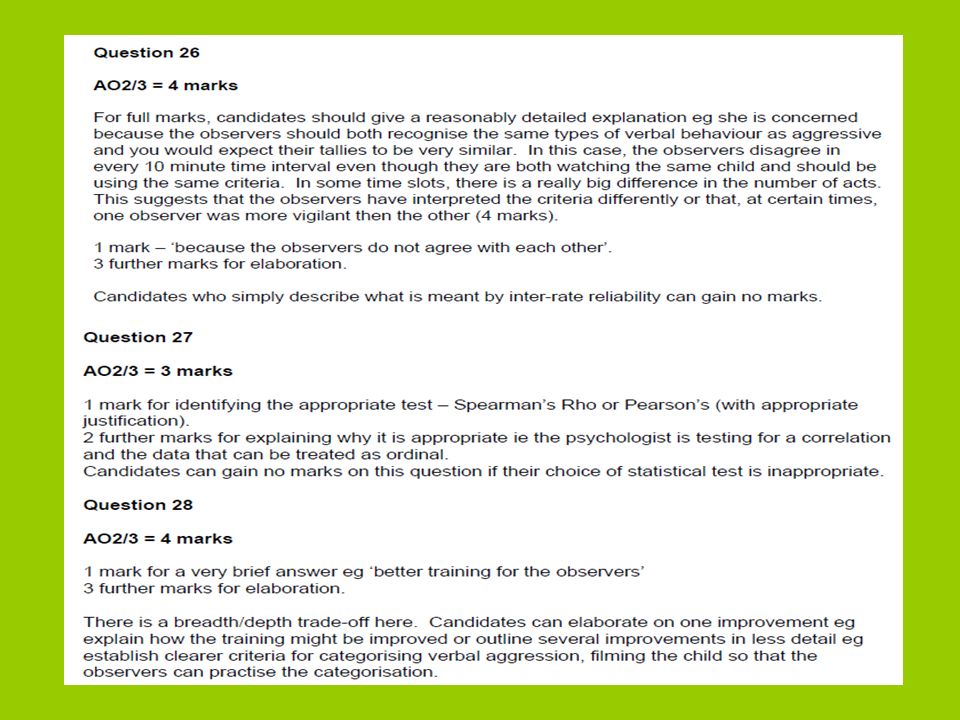
OVER TO YOU JUNE 2010 2 6 Using the data in Table 2, explain why the psychologist is concerned about inter- rater reliability. (4 marks) 2 7 Identify an appropriate statistical test to check the inter-rater reliability of these two observers. Explain why this is an appropriate test. (3 marks) 2 8 If the psychologist does find low reliability, what could she do to improve inter- rater reliability before proceeding with the observational research? (4 marks)
 2 7 Identify an appropriate statistical test to check the inter-rater reliability of these two observers. Explain why this is an appropriate test. (3 marks) 2 8 If the psychologist does find low reliability, what could she do to improve inter- rater reliability before proceeding with the observational research. (4 marks).")
46
June 2010 Q26-28 Examiner’s report

47
Types of validity Internal validity is the extent to which the research measures what it intends to. External validity is the extent to which the results of the research can be generalised. External validity can be further divided into: –Ecological validity – the extent to which results can be generalised settings other than the one it was carried out in. –Population validity – the extent to which results can be generalised to people other than the participants it was carried out on.

48
Assessing validity There are two main ways of assessing the validity of a measuring tool. –Criterion validity is a way of assessing validity by comparing the results with another measure. For example, we could compare the results of an IQ test with school results. If the other measure is roughly compared at the same time we call this concurrent validity. –Construct validity is a way of assessing validity by investigating if the measure really is measuring the theoretical construct it is suppose to be. For example, many theories of intelligence see intelligence as comprising a number of different skills and therefore to have construct validity an IQ test would have to test these different skills.

49
Improving validity Internal validity can be improved by careful operationalisation of variables and control of extraneous variables, including demand characteristics and investigator effects. Population validity can be improved by careful selection of participants. Ecological validity can be improved by carrying out research in natural environments.

50
OVER TO YOU JUNE 2011 1 9 What is meant by validity? (1 mark) 2 0 Explain how one factor in this study might affect its internal validity and how one factor might affect its external validity. (2 marks + 2 marks)
 2 0 Explain how one factor in this study might affect its internal validity and how one factor might affect its external validity. (2 marks + 2 marks).")
51
Q19 mark scheme

52
Q20 mark scheme

53
Q19 and 20 examiner’s report

54
Ethical considerations in design and conduct of psychological research For this section, you should be aware of the BPS ethical guidelines, be able to explain what ethical issues might arise when carrying out research, and how these ethical issues can be dealt with. Once again, you need to be sure that you can apply this knowledge to specific scenarios. For example, you should include a consideration of ethical issues when writing up a report of psychological research.

55
BPS ethical guidelines Protection of participants – P’s should experience no more distress than is likely in every day life. Confidentiality – Data must be stored securely and identifying details should be removed. Informed consent – P’s should be given enough information to be able to decide whether they want to take part. Deception – Where possible, P’s should not be deceived about the purpose of the study. Right to withdraw – P’s should be able to withdraw themselves and their data from the study at any time. Debrief – P’s should be told the purpose of the study when it is complete, and be given the opportunity to ask questions. They may also be given advice/offered counselling if appropriate. A full debrief is particularly important if P’s have been deceived as to the purpose of the study.

56
Dealing with ethical issues An ethical issue occurs when there is a dilemma between what the researcher wants to do and the rights and dignity of the participants. Some ways that ethical issues can be dealt with are: –Debriefing can deal with a lot of ethical issues such as deception and protection of participants. –Informed consent for children (under 16) can be gained from parents. –Prior general consent can be gained to deal with deception and informed consent (agreeing to take part in a study but not being fully aware of the details/aims of the research.
 can be gained from parents. –Prior general consent can be gained to deal with deception and informed consent (agreeing to take part in a study but not being fully aware of the details/aims of the research..")
57
OVER TO YOU JUNE 2010 Read the question stem 2 2 The psychologist needed to be sure that his participants understood the nature of the study so that they were able to give informed consent. Write a consent form which would be suitable for this study. Make sure there is sufficient information about the study for the participants to make an informed decision. (5 marks)
.")
58
Q22 mark scheme

59
Q22 examiner’s report

60
Appropriate selection of graphical representations Refer to your handout for a recap of graphical representations studied at AS. At A2, you should be able to identify which type of graph is suitable for the data provided and be able to sketch and correctly label each type of graph. It is important that both axis are clearly labelled as often there is a mark available for each one.

61
OVER TO YOU JUNE 2010 2 5 Use the data in Table 2 to sketch a scattergram. Label the axes and give the scattergram a title. (4 marks)
.")
62
June 2010 Q25 mark scheme

64
Inferential statistics At AS level, we used descriptive statistics such as bar charts and measures of central tendency to enable us to see patterns within the data (describe the data). At A2 level, we use inferential statistics too. By using statistical tests we can infer (assume based on evidence) whether a result is significant or not. This means that instead of saying it looks as though there is a difference in maths ability between males and females, we can use statistical tests to find out whether this difference is significant (i.e. meaningful).
 whether a result is significant or not. This means that instead of saying it looks as though there is a difference in maths ability between males and females, we can use statistical tests to find out whether this difference is significant (i.e. meaningful)..")
65
Probability Probability is the likelihood (shown as a decimal or percentage) that any difference or association between groups has occurred simply due to chance. When using a statistical test, we must decide on a level of probability that is acceptable (a p value). In psychology, a p value of < 0.05 is usually used. This means that there is a 5% or less chance than our results are due to chance. A 5% level is chosen because it is believed to give the best chance of avoiding a Type 1 or Type 2 error (explained later).
. In psychology, a p value of < 0.05 is usually used. This means that there is a 5% or less chance than our results are due to chance. A 5% level is chosen because it is believed to give the best chance of avoiding a Type 1 or Type 2 error (explained later)..")
66
Significance If a result is found to be significant, it means that the difference or association between groups is too great to be due to chance. So, although we may find a difference between the maths ability of males and females, there may not be enough of a difference to be significant. In other words, the difference may be due to chance only. To investigate this, we would need to conduct a statistical test on the data.

67
Interpretation of significance Each statistical test involves taking the data collected in the study and carrying out a mathematical test to produce a single value called the observed value (because it is based on the observations made). The name given to the observed value varies depending on the test used. –Chi square = rho –Spearmans rank = X2 –Mann Whitney = U –Wilcoxon = T

68
Interpretation of significance The observed value is then compared to another number that is found in a table of critical values (this will be provided for you in the exam). This is called the critical value. Depending on the test used, our result is significant if the observed value is more or less than the critical value.

69
In the exam, you will always be told whether the observed value should be more or less than the critical value THE IMPORTANCE OF R If the test has an R in it (Chi square and Spearmans), the observed value should be gReateR than the critical value. For tests without an R, the observed value should be less than the critical value.

70
Type 1/Type 2 errors A Type 1 error is a false positive. It occurs when we accept the experimental hypothesis as significant when it is not (thus rejecting the null hypothesis). A Type 2 error is a false negative. It occurs when we reject the experimental hypothesis (and accept the null hypothesis) when it is in fact significant. The chance of Type 1/2 errors is associated with the significance level (P value) we use. If we use a 1% level, the chance of a Type 2 error is increased, whereas a Type 1 error is more likely when a 10% significance level is used.
. A Type 2 error is a false negative. It occurs when we reject the experimental hypothesis (and accept the null hypothesis) when it is in fact significant. The chance of Type 1/2 errors is associated with the significance level (P value) we use. If we use a 1% level, the chance of a Type 2 error is increased, whereas a Type 1 error is more likely when a 10% significance level is used..")
71
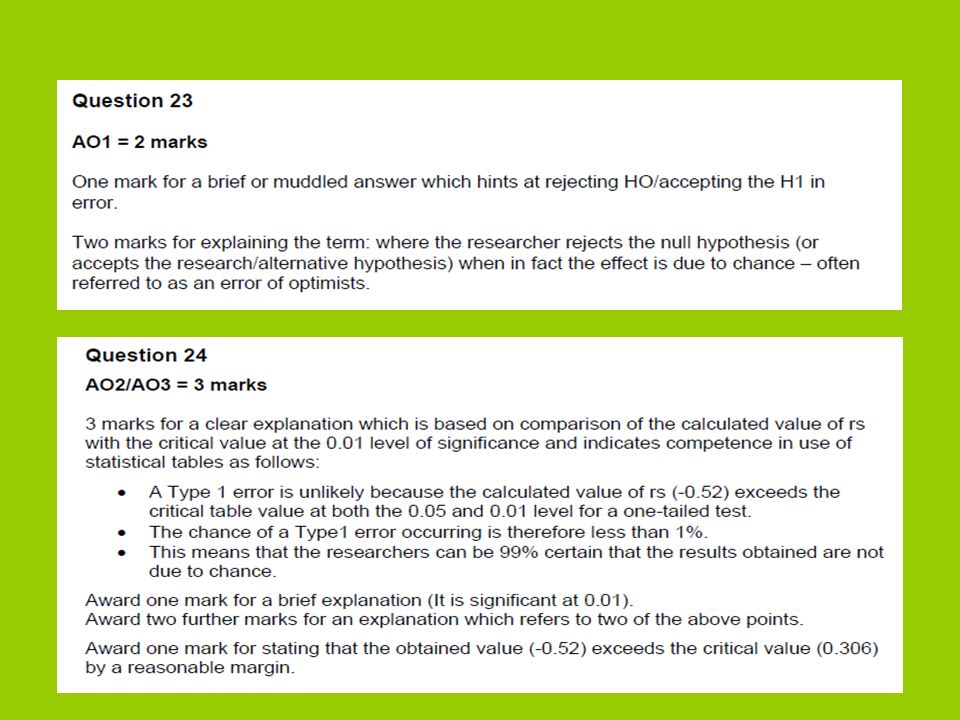
OVER TO YOU JAN 2012 2 3 Explain what is meant by a Type 1 error. (2 marks) 2 4 Use the information in Table 1 above to explain why the psychologists did not think that they had made a Type 1 error in this case. (3 marks)
 2 4 Use the information in Table 1 above to explain why the psychologists did not think that they had made a Type 1 error in this case. (3 marks).")
73
Jan 2012 Q23/24 Examiner’s report

74
Factors affecting choice of statistical test When choosing a test you will need to be able answer 3 questions: –The level of measurement of the data – nominal, ordinal or interval/ratio. –Whether you are looking for a difference or association. –The experimental design used - whether you are using an independent groups design or not.

75
Levels of measurement Nominal data is category data, e.g. whether participants are stressed or not. There can be no overlap – they are either in one category or another. Ordinal data is data that is ranked in order, but with no meaningful difference between them. This might be used to rank P’s in order of how stressed they are. Interval/ratio data is measured on a scale. This would be used when participants are given a score on a stress test.

76
Identifying levels of measurement You need to be able to identify the level of measurement used in a study. Remember, the data is the result of the dependent variable e.g. the score on a memory test or the time taken to perform a task. One common mistake when trying to identify the level of measurement used is to assume that it is nominal data because it uses men in one group and women in another. However, this is the IV, not the DV. The level of measurement (using the previous example) would be the scores on a maths test, which would be interval/ratio data.
 would be the scores on a maths test, which would be interval/ratio data..")
77
Factors affecting choice of statistical test Difference or association – are you looking for a difference between two groups e.g. stress levels of doctors and teachers or an association e.g. stress levels and annual pay? Experimental design – are you using an independent groups design? For the purposes of choosing a test, a matched pairs design is treated in the same way as a repeated measures design (i.e. not as two separate groups).
..")
78
3 questions Is it nominal data? Use Chi square –Yes? Use Chi square –No? Continue to next Q Is it a correlation? Use Spearman's Rho –Yes? Use Spearman's Rho –No? Continue to next Q Is it an independent groups design? Use Mann Whitney –Yes? Use Mann Whitney Use Wilcoxon –No? Use Wilcoxon

79
OVER TO YOU JANUARY 2011 Read the question stem 2 3 The psychologist used a Mann- Whitney test to analyse the data. Give two reasons why he chose this test. (2 marks)
.")
80
The use of inferential statistics Calculate the observed value. Consult the appropriate critical values table and find the relevant critical value using the following steps: 1.Select whether a one or two tailed test is to be used. 2.Select the appropriate level of significance. 3.Calculate degrees of freedom (for chi square). 4.Identify the number of participants (for Spearmans and Wilcoxon – shown as N) 5.For Mann Whitney, you will need to know the number of participants in each group (shown as N 1 and N 2 ).
. 4.Identify the number of participants (for Spearmans and Wilcoxon – shown as N) 5.For Mann Whitney, you will need to know the number of participants in each group (shown as N 1 and N 2 )..")
81
One or two tailed test? You will also need to decide whether to use a one or two tailed test. This depends on whether the hypothesis is directional or non directional. For a directional hypothesis you should use a one tailed test. A two tailed test should be used for a non directional hypothesis.

82
Critical values table

83
Chi square Used with nominal data. Can be used for a difference or association. Needs a minimum of 20 participants. Data should be plotted in a contingency table. Degrees of freedom (DF) should be calculated by multiplying the number of rows in the contingency table, minus one, by the number of columns, minus one. However, in the exam, you will always be provided with the figure for degrees of freedom. MaleFemaleTotals Sleep ≥ 8 hours 51217 Sleep < 8 hours 10929 Totals152136
 should be calculated by multiplying the number of rows in the contingency table, minus one, by the number of columns, minus one. However, in the exam, you will always be provided with the figure for degrees of freedom. MaleFemaleTotals Sleep ≥ 8 hours Sleep < 8 hours Totals")
84
Spearman’s Rho Used when: –A hypothesis predicts a correlation between 2 co-variables. –When 2 sets of data are pairs of scores from one person, e.g. hair colour & IQ score. –The data are ordinal or interval, i.e. NOT nominal.

85
Mann Whitney Used when: –The hypothesis predicts a difference between 2 sets of data. –The 2 sets of data are from separate groups of pp’s – independent groups. –The data needs to be ordinal or interval – NOT nominal.

86
Wilcoxon Used when: –The hypothesis predicts a difference between 2 sets of data. –The 2 sets of data are pairs of scores from one person – repeated measures/matched pairs. –The data needs to be ordinal or interval – NOT nominal.

87
Reporting your results You should state: –The observed value –The critical value –The probability value (e.g. p<0.05) –The type of test used (e.g. Chi square) –The degrees of freedom (df) for Chi square –The number of participants –Whether you accept/reject the alternative/null hypothesis –Whether or not the result is significant
 –The type of test used (e.g. Chi square) –The degrees of freedom (df) for Chi square –The number of participants –Whether you accept/reject the alternative/null hypothesis –Whether or not the result is significant.")
88
Example As the observed value of 4.56 is greater than the critical value of 3.14, using a Chi square test with 20 participants, at a significance level of p < 0.05, with 2 degrees of freedom, we can reject the null hypothesis and accept the alternative hypothesis. The result is significant.

89
OVER TO YOU JUNE 2010 Read the question stem (and Table 1). He set his significance level at 5%. His calculated value was T = 53. Using Table 1, state whether or not the psychologist’s result was significant. Explain your answer. (3 marks)
.")
90
Analysis and interpretation of qualitative data Qualitative data involved people’s meanings, experiences and descriptions. It is particularly good for researching attitudes, opinions and beliefs. Data usually consists of verbal or written descriptions. Most qualitative methods look for common themes within the data. These may be illustrated with the use of direct quotes.

91
Content analysis Content analysis is a very simple form of analysing qualitative data by converting it into a quantitative form by counting themes within the data. –Identify the material to be studied (e.g. interviews, adverts, etc.) –Identify coding units. –Count the number of times that each theme occurs in the data.
 –Identify coding units. –Count the number of times that each theme occurs in the data..")
92
Evaluation of content analysis STRENGTHS A very simple and relatively quick method of analysing qualitative data. LIMITATIONS Some of the detail and richness of the data may be lost in converting to qualitative categories. The research could be biased in their interpretation of the data – this can be reduced by having several raters and checking for inter-rater reliability.

93
OVER TO YOU JUNE 2010 Read the question stem 2 0 What is meant by the term content analysis? (1 mark) 2 1 Explain how the psychologist might have carried out content analysis to analyse these drawings. (3 marks)
 2 1 Explain how the psychologist might have carried out content analysis to analyse these drawings. (3 marks).")
94
June 2010 Q20/21 mark scheme

95
June 2010 Q20/21 examiner’s report

96
Conventions of reporting on psychological investigations You need to be aware of the structure of a psychological report and what is included in each section. –Abstract –Introduction –Method –Results –Discussion –Appendix

97
AbstractAbstract – a very brief summary of the study covering the aims/hypothesis, method/procedures, results and conclusions. IntroductionIntroduction – this usually includes a review of past research in the area, and an explanation of why the current research is being carried out. The research aim and/or hypothesis will usually be included in the introduction too.

98
MethodMethod – a detailed description of what the researchers did, providing enough information to replicate the study. This section is often broken down to include: –Design – an overview of the study, including justification for design decisions (e.g. why a field experiment was used rather than a lab experiment). Ethical issues may also be addressed here. –Participants – the sample size and other important information (e.g. gender, ethnicity, etc where relevant). The sampling and recruitment method should also be included. –Apparatus/materials – equipment used, such as standardised instructions, computer programs, questionnaires, interview schedules, etc. –Procedure – a step by step description of how the study was carried out.
. Ethical issues may also be addressed here. –Participants – the sample size and other important information (e.g. gender, ethnicity, etc where relevant). The sampling and recruitment method should also be included. –Apparatus/materials – equipment used, such as standardised instructions, computer programs, questionnaires, interview schedules, etc. –Procedure – a step by step description of how the study was carried out..")
99
ResultsResults – this section contains what the researchers found. It may include descriptive and inferential statistics. DiscussionDiscussion – the researchers offer explanations for the behaviours they observed and might also consider the implications of the results and make suggestions for future research. ReferencesReferences – the full details of any sources that have been used in the report (books, journals and websites). AppendixAppendix – anything that is important to the report but does not fit in the main body of the report e.g. raw data, copies of interview schedules, questionnaires, etc.
. AppendixAppendix – anything that is important to the report but does not fit in the main body of the report e.g. raw data, copies of interview schedules, questionnaires, etc..")
100
Report writing As part of the report writing process, you will also need to be able to write: –Consent form – giving enough information for P’s to make an informed decision about taking part in the research. –Debrief – informing participants of the full nature of the research and offering the opportunity to ask questions. –Standardised instructions – given/read to P’s to ensure consistency/control extraneous variables.

101
OVER TO YOU JUNE 2011 1 8 What is the purpose of the introduction section of a report? (2 marks)
")
102
June 2011 Q18 mark scheme and examiner’s report

103
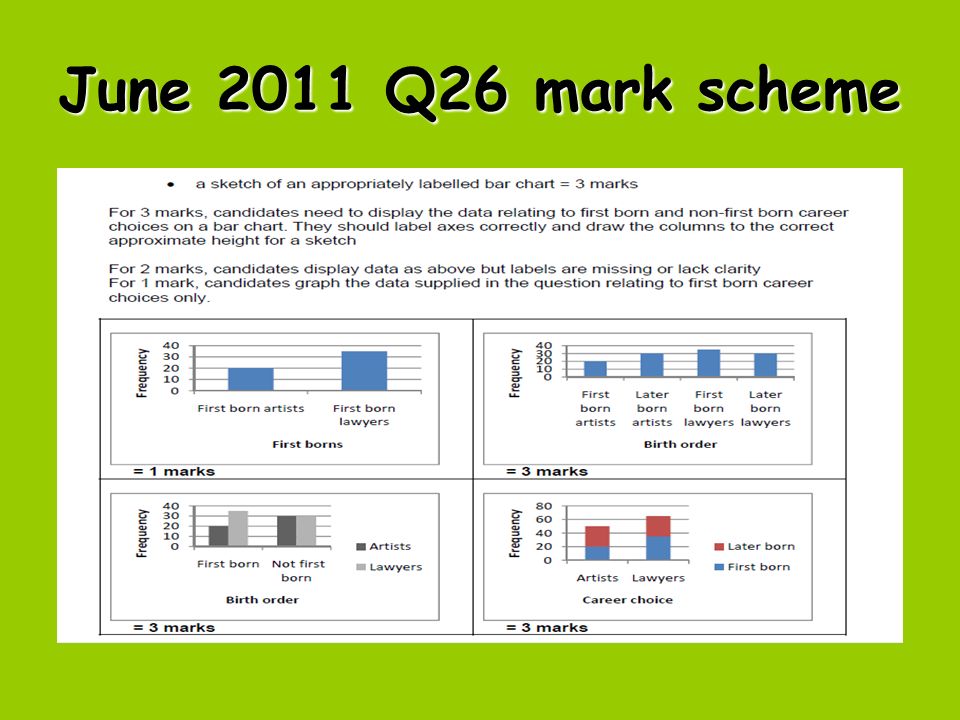
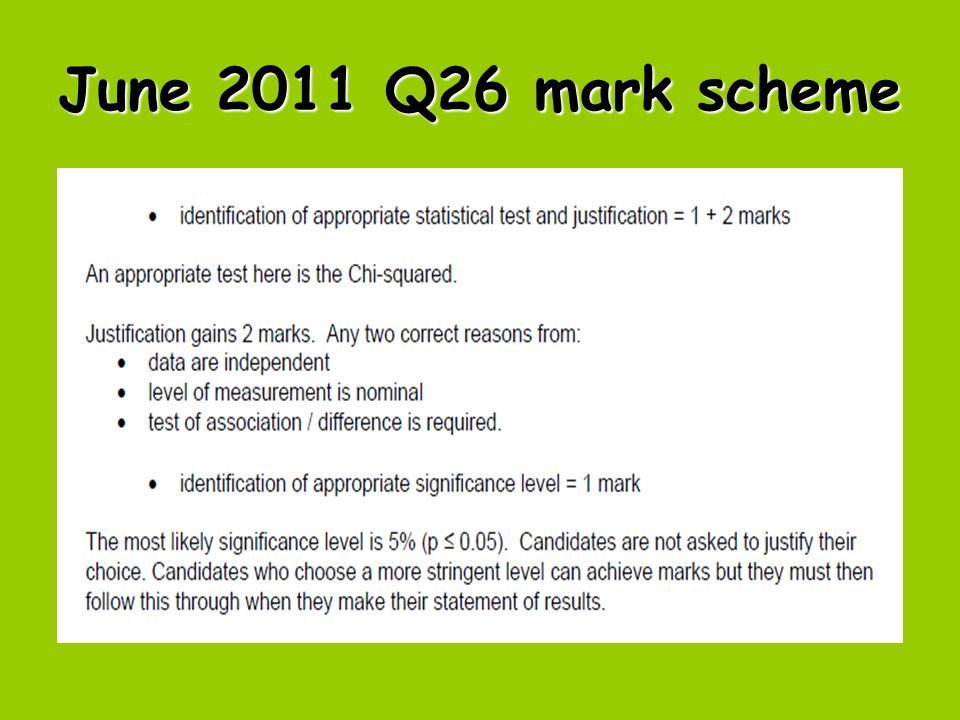
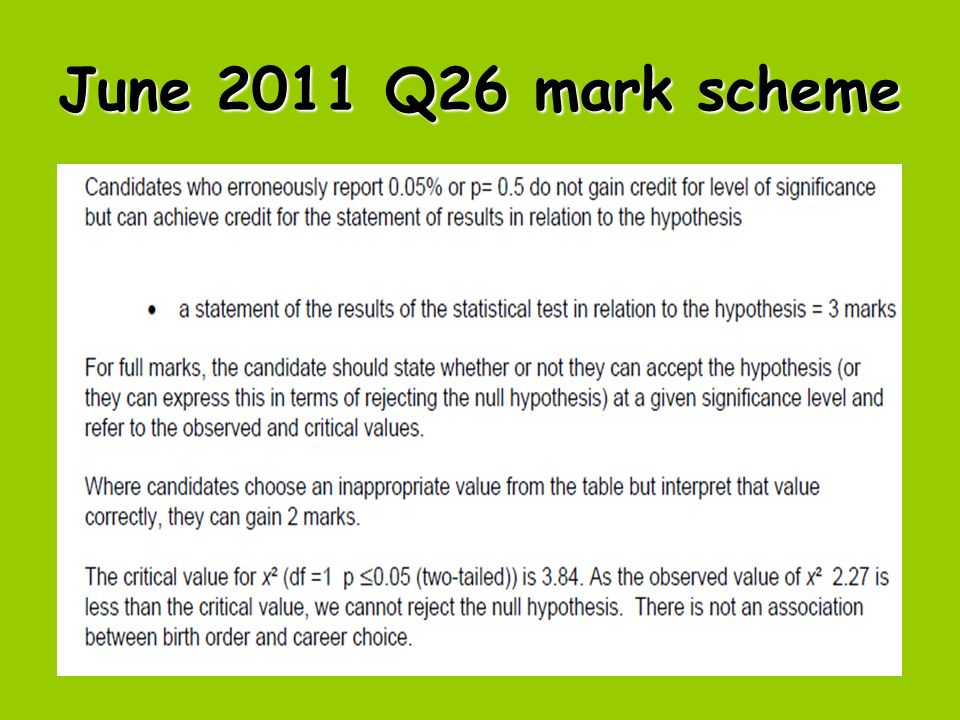
OVER TO YOU JUNE 2011 Read the question stem 2 6 Imagine that you are writing the results section of the report on this investigation. Using information from the description of the study above and the relevant information from the statistical table, provide contents suitable for the results section. You must provide all of the following: –an appropriately labelled 2 x 2 contingency table –a sketch of an appropriately labelled bar chart –identification of the appropriate statistical test with justification for its use –identification of an appropriate significance level – a statement of the results of the statistical test in relation to the hypothesis.

104
June 2011 Q26 mark scheme

108
June 2011 Q26 examiner’s report

Similar presentations


 Psychological Investigations.>")


