Download presentation
Presentation is loading. Please wait.

1
1 Cost of Potato Production in Idaho Project Objective 1. Collect data annually from input suppliers, and as necessary equipment dealers and potato growers. Objective 2. Revise & update existing potato costs & returns estimates to reflect current input costs and production practices. Objective 3. To develop cost of production estimates for new varieties or new or proposed production systems as needed or as requested.

2
2 Cost of Potato Production in Idaho Project Objective 4. To calculate changes in production cost per acre and per hundredweight from the previous year and 5-year trend. Objective 5. To develop an annual report on changes in cost of production and make this available to the Idaho potato industry & present the information at the Idaho Potato Conference & elsewhere as requested. Objective 6. To maintain an advisory committee that represents different segments of the Idaho potato industry, to meet annually to obtain input and to review & discuss the cost of production estimates.

3
2016 Idaho Potato Production Costs Review Idaho Potato Conference January 21, 2016 Paul Patterson Ben Eborn Extension Agricultural Economist beborn@uidaho.edu Idaho AgBiz www.uidaho.edu/cals/idaho-agbiz

4
Paul’s boots

5
The Mailman = me Record for most career assists = Paul Patterson

6
6 Cost of Production Estimates Typical or representative costs of production estimates, not averageTypical or representative costs of production estimates, not average Model farm for each region or sub regionModel farm for each region or sub region Based on grower surveys, sequence of operationsBased on grower surveys, sequence of operations Economic costs, not accounting (cash) costs Opportunity cost for all resources Machinery: 75% of replacement cost new Management depreciation, not tax depreciation
 costs Opportunity cost for all resources Machinery: 75% of replacement cost new Management depreciation, not tax depreciation")
7
7 Procedures and Assumptions Management: ~5% of total expenses (gross receipts) Overhead: ~2.5% of cash operating expenses Land: crop specific 1-year cash rental value Surface water, avg. price by region Pressurization only, per acre-inch water applied, using Idaho Power Ag. Irrigation Service rate

8
8 Annual Crop Input Cost Summary Annual survey: February through October Ag Lenders Seed dealers (seed potato growers) Chemical Fertilizer Dealers Custom Applicators * Fuel Suppliers: February, April, June, August Irrigation Districts / Canal Companies Idaho Power Irrigation Service Rate (Schedule 24)
 Chemical Fertilizer Dealers Custom Applicators * Fuel Suppliers: February, April, June, August Irrigation Districts / Canal Companies Idaho Power Irrigation Service Rate (Schedule 24)")
9
9 Budget Changes: 2015 Specific changes by region - 2015: see pages 10-11 No change in herbicides, either product or # of applications for any region Southwestern Idaho: Foliar Fungicides Increased applications from 6 to 8 Increased products applied from 7 to 10 Foliar Insecticides Increased applications from 5 to 7 Increased products from 5 to 7

10
10 Budget Changes: 2015 Southcentral Idaho: Foliar Fungicides Increased applications from 5 to 7 Increased products applied from 7 to 8 Foliar Insecticides Increased applications from 4 to 7 (correction to p. 10 & 3x in Appendix B for Agri-Mek) Increased products from 4 to 7 (correction to p. 10 & 3x in Appendix B for Agri-Mek)
 Increased products from 4 to 7 (correction to p. 10 & 3x in Appendix B for Agri-Mek).")
11
11 Budget Changes: 2015 Eastern Idaho - South: Foliar Fungicides Increased applications from 5 to 6 Increased products applied from 7 to 8 Foliar Insecticides Increased applications from 3 to 4 Increased products from 3 to 4

12
How much did it cost to grow, harvest and sort potatoes in 2015?

13
FumigatedTotal Cost/acYield Cost per Cwt SWI – Operating$2,511515$4.88 SCI – Operating$2,228470$4.74 EI-S – Operating$1,993425$4.34 SWI – Ownership$1,223$2.37 SCI – Ownership$1,073$2.28 EI-S – Ownership$938$2.39 SWI – Total Costs$3,734$7.25 SCI – Total Costs$3,301$7.02 EI-S – Total Costs$2,931$6.73 2015 Russet Burbank: Cost of Production Cost to grow, harvest & sort. Table 11-A & 11-B and 12-A & 12-B.

14
Non-FumigatedTotal Cost/acYield Cost per Cwt SCI – Operating$1,868425$4.40 EI-S – Operating$1,669385$4.34 EI-N – Operating$1,554360$4.32 SCI – Ownership$1,061$2.50 EI-S – Ownership$930$2.42 EI-N – Ownership$818$2.27 SCI – Total Costs$2,929$6.90 EI-S – Total Costs$2,599$6.76 EI-N – Total Costs$2,372$6.59 2015 Russet Burbank: Cost of Production Cost to grow, harvest & sort. Table 11-A & 11-B and 12-A- and 12-B.

15
How much did costs change in 2015? It Depends: Region Acre vs. Cwt Which inputs

16
16 Potato Cost Changes: 2014 to 2015 Per Acre ChangesPer Acre Changes Total cost/acre: $ change +$41 to +$101 Total cost/acre: % Change +1.6% to +3.6% Total Cost/ Cwt $ change -$0.13 to +$0.26 Total cost/Cwt: % Change -1.9% to +3.7% Yield changes:Yield changes: SWI-10 cwt-1.9%*Adjusted RB Yield (Avg. -4%)SWI-10 cwt-1.9%*Adjusted RB Yield (Avg. -4%) SCI+5 cwt+1.1 to +1.2%SCI+5 cwt+1.1 to +1.2% SEI-S+5 cwt+1.2 to +1.3%SEI-S+5 cwt+1.2 to +1.3% SEI-N+5 cwt+1.3%SEI-N+5 cwt+1.3% Per Cwt ChangesPer Cwt Changes
SWI-10 cwt-1.9%*Adjusted RB Yield (Avg. -4%) SCI+5 cwt+1.1 to +1.2%SCI+5 cwt+1.1 to +1.2% SEI-S+5 cwt+1.2 to +1.3%SEI-S+5 cwt+1.2 to +1.3% SEI-N+5 cwt+1.3%SEI-N+5 cwt+1.3% Per Cwt ChangesPer Cwt Changes.")
17
Cost CategoriesSWISCISEI-S 2014 Operating Costs$2,457$2,182$1,956 2015 Operating Costs$2,511$2,228$1,993 $ Change+$54+$46+$37 % Change+2.9%+2.1%+1.9% 2014 Ownership Costs$1,214$1,035$911 2015 Ownership Costs$1,223$1,073$938 $ Change+$9+$38+$27 % Change+0.7%+3.7%+3.0% 2014 Total Costs$3,671$3,217$2,867 2015 Total Costs$3,734$3,301$2,931 $ Change+$63+$84+$64 % Change+1.7%+2.6%+2.2% Idaho Fumigated RB Production Costs per Acre Cost to grow, harvest & sort. Table 11-A

18
Cost CategoriesSCISEI-SSEI-N 2014 Operating Costs$1,803$1,656$1,508 2015 Operating Costs$1,868$1,669$1,554 $ Change+$65+$13+$46 % Change+3.6%+0.8%+3.1% 2014 Ownership Costs$1,025$902$795 2015 Ownership Costs$1,061$930$818 $ Change+$36+28$+$23 % Change+3.5%+3.1%+2.9% 2014 Total Costs$2,828$2,558$2,303 2015 Total Costs$2,929$2,599$2,372 $ Change+$101+$41+$69 % Change+3.6%+1.6%+3.0% ID Non-Fumigated RB Production Costs per Acre Cost to grow, harvest & sort. Table 11-B

19
Cost CategoriesSWISCISEI-S 2014 Operating Costs$4.68$4.69$4.48 2015 Operating Costs$4.88$4.74$4.34 $ Change+$0.20+$0.05-$0.14 % Change+4.3%+1.1%-3.1% 2014 Ownership Costs$2.31$2.23$2.38 2015 Ownership Costs$2.37$2.28$2.39 $ Change+$0.06+$0.05+$0.01 % Change+2.6%+2.2%+0.4% 2014 Total Costs$6.99$6.92$6.86 2015 Total Costs$7.25$7.02$6.73 $ Change+$0.26+$0.10-$0.13 % Change+3.7%+1.4%-1.9% Idaho Fumigated RB Production Costs per Cwt Cost to grow, harvest & sort. Table 12-A.

20
Cost CategoriesSCISEI-SSEI-N 2014 Operating Costs$4.29$4.36$4.25 2015 Operating Costs$4.40$4.34$4.32 $ Change+$0.11-$0.02+$0.07 % Change+2.6%-0.5%+1.6% 2014 Ownership Costs$2.44$2.37$2.24 2015 Ownership Costs$2.50$2.42$2.27 $ Change+$0.06+$0.05+$0.03 % Change+2.5%+2.1%+1.3% 2014 Total Costs$6.73 $6.49 2015 Total Costs$6.90$6.76$6.59 $ Change+$0.17+$0.03+$0.10 % Change+2.5%+0.4%+1.5% ID Non-Fumigated RB Production Costs per Cwt Cost to grow, harvest & sort. Table 12-B.

21
Which input cost categories changed in 2015 and by how much?

22
Cost change summary for 2015 Operating Expense Category $ Change/acre% Change/acre Seed+$0 to +$1/ac-0.4 to +0% Fertilizer+$4 to +$27/ac+0.8 to +6.0% Pesticides & Chemicals+$15 to +$48/ac+4.9 to +23% Custom & Consultant+$6 to +$38/ac+5.0to +31% IrrigationFlat Machinery (FOLR)-$30 to -$35-18 to -20% Labor+$3 to +$5/ac+2.1 to 3.3% Other-$2 to +$2/ac-1.1 to +1.2% Operating interestFlat Table 10.
-$30 to -$35-18 to -20% Labor+$3 to +$5/ac+2.1 to 3.3% Other-$2 to +$2/ac-1.1 to +1.2% Operating interestFlat Table 10.")
23
Cost change summary for 2015 Ownership Expense Category $ Change/acre% Change/acre Field Equipment+$2 to +$5/ac+1.2 to 2.8% % Overhead+$1 to +$2/ac+1.2 to +3.3% Land+$0 to + $25/ac+0 to +4.2% Handling/Sorting Equip.+$1 to +$3/ac+4% Storage System +2.5% Table 10.

24
Field-run vs. Paid Yield What percentage of the potatoes that you deliver do you get paid for? Does it vary by market?

25
2015 Production Costs, Storage Ownership & Repair Costs, & Monthly Storage Operating Costs (Tables A-2, B-2 andC-2) SWI Field-Run SWI Paid-Yield SCI Field-Run SCI Paid-Yield EI-S Field-Run EI-S Paid-Yield Base COP:$7.25$7.63$7.02$7.39$6.90$7.26 + Storage Owner.$7.61$8.01$7.36$7.75$7.25$7.63 + Storage Repairs $7.65$8.05$7.40$7.79$7.29$7.68 Oct$7.87$8.28$7.61$8.01$7.350$7.89 Nov*$8.04$8.46$7.78$8.19$7.67$8.07 Dec$8.13$8.56$7.86$8.28$7.75$8.16 Jan$8.22$8.65$7.95$8.36$7.83$8.25 Feb$8.30$8.74$8.03$8.45$7.92$8.33 Mar$8.39$8.84$8.11$8.54$8.00$8.42 Apr*$8.58$9.04$8.30$8.74$8.18$8.61 May$8.69$9.15$8.40$8.85$8.29$8.72 Jun$8.82$9.28$8.52$8.97$8.41$8.85 Paid-Yield = 95% of Field-Run YieldFumigated *Sprout inhibitor applied Storage Operating Costs: labor, power, chemicals, interest, shrink and insurance SWI = Southwestern Idaho, SCI = Southcentral Idaho, EI = Eastern Idaho
 SWI Field-Run SWI Paid-Yield SCI Field-Run SCI Paid-Yield EI-S Field-Run EI-S Paid-Yield Base COP:$7.25$7.63$7.02$7.39$6.90$ Storage Owner.$7.61$8.01$7.36$7.75$7.25$ Storage Repairs $7.65$8.05$7.40$7.79$7.29$7.68 Oct$7.87$8.28$7.61$8.01$7.350$7.89 Nov*$8.04$8.46$7.78$8.19$7.67$8.07 Dec$8.13$8.56$7.86$8.28$7.75$8.16 Jan$8.22$8.65$7.95$8.36$7.83$8.25 Feb$8.30$8.74$8.03$8.45$7.92$8.33 Mar$8.39$8.84$8.11$8.54$8.00$8.42 Apr*$8.58$9.04$8.30$8.74$8.18$8.61 May$8.69$9.15$8.40$8.85$8.29$8.72 Jun$8.82$9.28$8.52$8.97$8.41$8.85 Paid-Yield = 95% of Field-Run YieldFumigated *Sprout inhibitor applied Storage Operating Costs: labor, power, chemicals, interest, shrink and insurance SWI = Southwestern Idaho, SCI = Southcentral Idaho, EI = Eastern Idaho")
26
2015 Production Costs, Storage Ownership & Repair Costs, & Monthly Storage Operating Costs (Tables D-2, E-2 andF-2) SCI Field-Run SCI Paid-Yield EI-S Field-Run EI-S Paid-Yield EI-N Field-Run EI-N Paid-Yield Base COP:$6.89$7.26$6.75$7.11$6.59$6.93 + Storage Owner.$7.25$7.63$7.11$7.48$6.95$7.31 + Storage Repairs $7.29$7.68$7.15$7.53$6.99$7.35 Oct$7.59$7.89$7.35$7.74$7.19$7.57 Nov*$7.67$8.07$7.52$7.92$7.36$7.75 Dec$7.75$8.16$7.61$8.01$7.44$7.83 Jan$7.84$8.25$7.69$8.09$7.53$7.92 Feb$7.92$8.34$7.77$8.18$7.61$8.01 Mar$8.01$8.43$7.86$8.27$7.69$8.10 Apr*$8.19$8.62$8.04$8.46$7.88$8.29 May$8.29$8.73$8.14$8.57$7.98$8.40 Jun$8.42$8.86$8.26$8.70$8.10$8.52 Paid-Yield = 95% of Field-Run YieldNon-Fumigated *Sprout inhibitor applied Storage Operating Costs: labor, power, chemicals, interest, shrink and insurance SWI = Southwestern Idaho, SCI = Southcentral Idaho, EI = Eastern Idaho
 SCI Field-Run SCI Paid-Yield EI-S Field-Run EI-S Paid-Yield EI-N Field-Run EI-N Paid-Yield Base COP:$6.89$7.26$6.75$7.11$6.59$ Storage Owner.$7.25$7.63$7.11$7.48$6.95$ Storage Repairs $7.29$7.68$7.15$7.53$6.99$7.35 Oct$7.59$7.89$7.35$7.74$7.19$7.57 Nov*$7.67$8.07$7.52$7.92$7.36$7.75 Dec$7.75$8.16$7.61$8.01$7.44$7.83 Jan$7.84$8.25$7.69$8.09$7.53$7.92 Feb$7.92$8.34$7.77$8.18$7.61$8.01 Mar$8.01$8.43$7.86$8.27$7.69$8.10 Apr*$8.19$8.62$8.04$8.46$7.88$8.29 May$8.29$8.73$8.14$8.57$7.98$8.40 Jun$8.42$8.86$8.26$8.70$8.10$8.52 Paid-Yield = 95% of Field-Run YieldNon-Fumigated *Sprout inhibitor applied Storage Operating Costs: labor, power, chemicals, interest, shrink and insurance SWI = Southwestern Idaho, SCI = Southcentral Idaho, EI = Eastern Idaho")
28
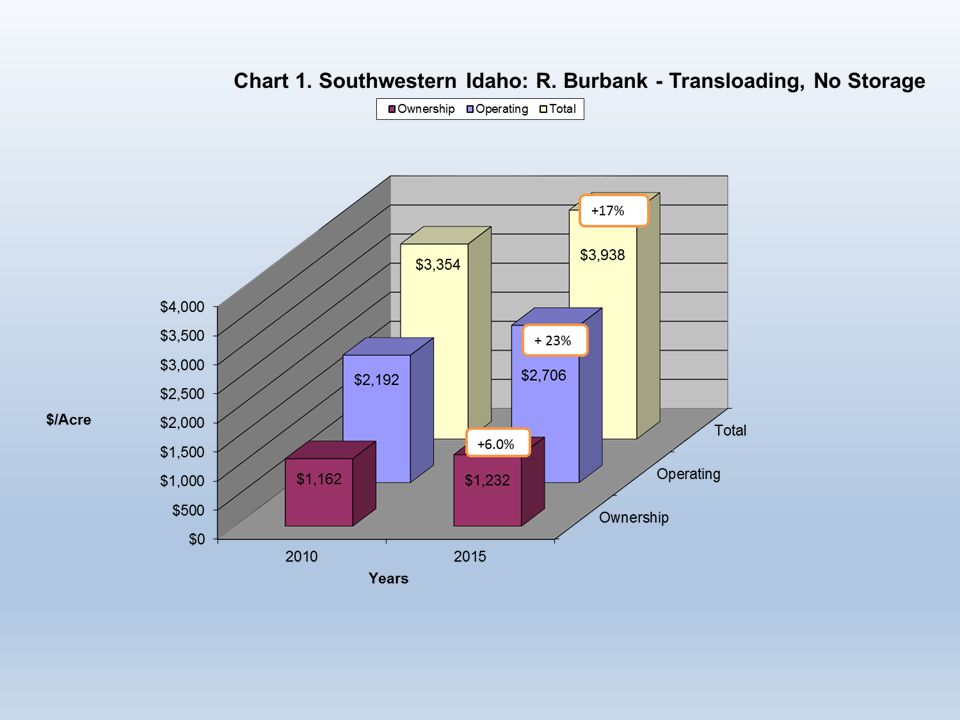
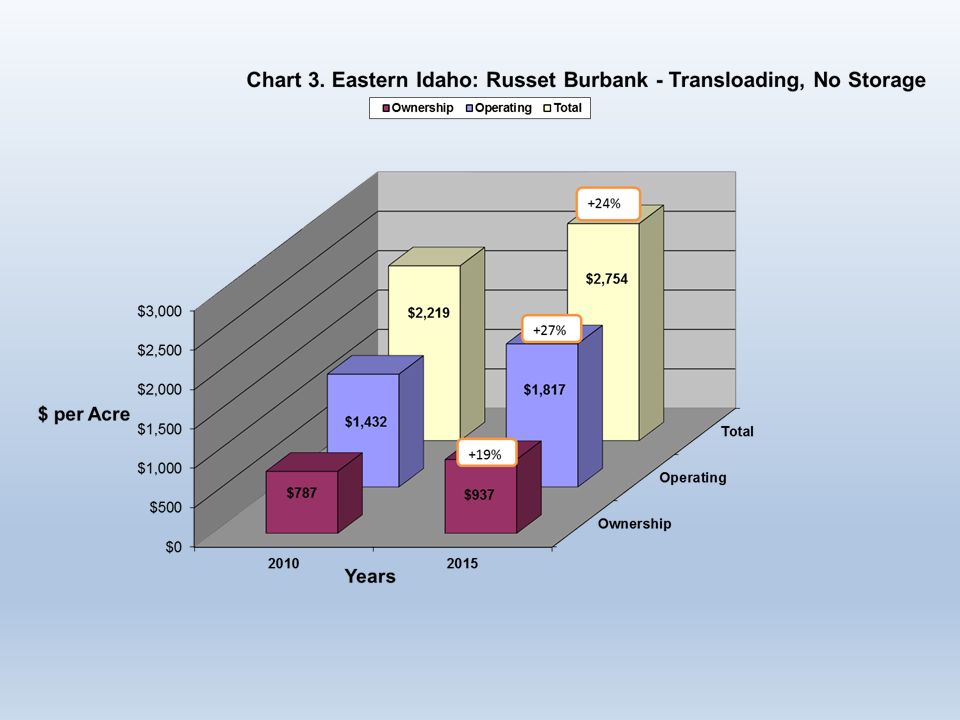
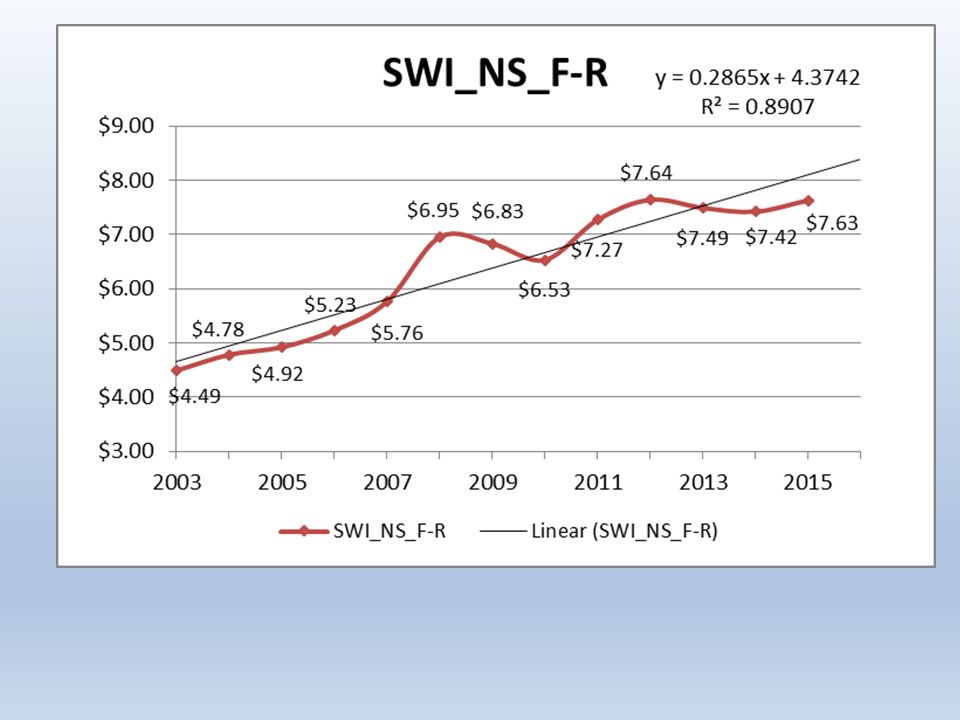
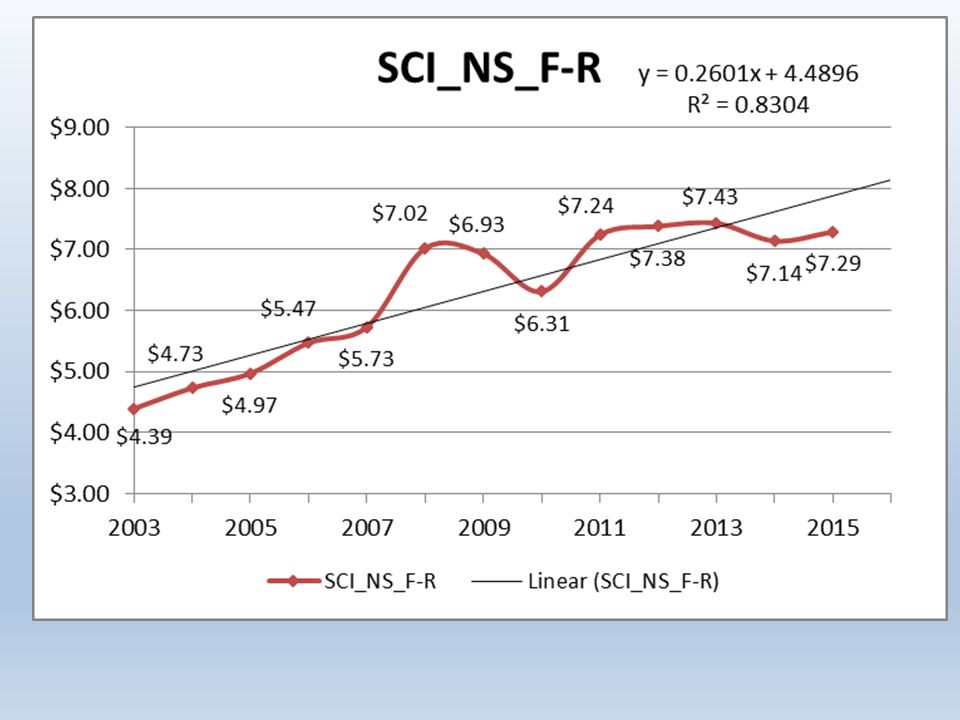
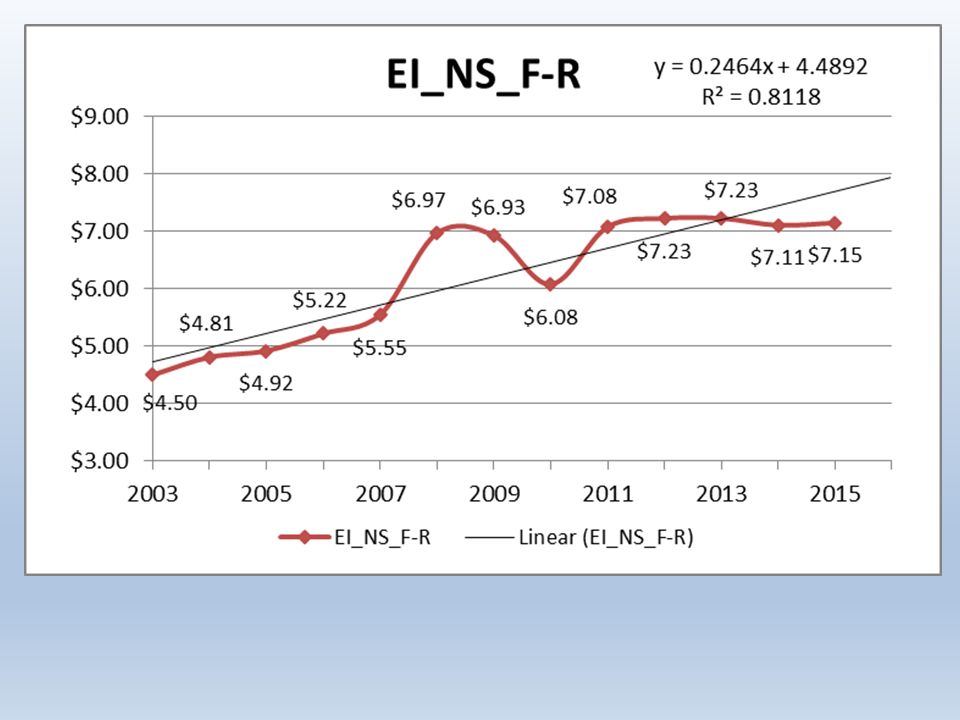
How have costs changed over time? 2003 to 2015

35
Questions?

Similar presentations


 and.>")


