Download presentation
Presentation is loading. Please wait.

1
Event-Driven Stream Processing with Microsoft StreamInsight Roman Schindlauer

2
Understanding Streaming Data Question: “how many red cars are in the parking lot”. Answering with a relational database: –Walk out to the parking lot. –Count vehicles that are Red Cars SELECT COUNT(*) FROM ParkingLot WHERE type = ‘AUTO’ AND color = ‘RED’ SELECT COUNT(*) FROM ParkingLot WHERE type = ‘AUTO’ AND color = ‘RED’
 FROM ParkingLot WHERE type = ‘AUTO’ AND color = ‘RED’ SELECT COUNT(*) FROM ParkingLot WHERE type = ‘AUTO’ AND color = ‘RED’.")
3
Understanding Streaming Data What about: “How many red cars have passed the 40 th street exit on the 520 in the last hour”? Answering with a relational database: –Pull over and park all vehicles in a lot, keeping them there for an hour. –Count vehicles that are in the lot. Doesn’t seem like a great solution…

4
Understanding Streaming Data Different kinds of questions require different ways of answering them. Answering the question with a streaming data processing engine: –Stand by the freeway, count red cars as they pass by. –Write down the answer, deliver the answer. This is the streaming data paradigm in a nutshell – ask questions about data in flight

5
StreamInsight Scenarios ManufacturingUtilitiesOil & Gas Alarming, Notifications Rotating equipment monitoring Condition-based maintenance AMI/SmartGrid Grid management Generation/demand balancing Measurement / Logging while drilling Well monitoring Facility management Financial ServicesWeb AnalyticsTelco Algorithmic Trading Risk Management Market Monitoring Behavioral Targeting Load Monitoring QoS Monitoring CDR Aggregation Call Quality Monitoring

6
StreamInsight for Oil & Gas Process Control Data Aggregation: Continuous Time Window –Detect process data events and patterns in moving windows –report non-conformance immediately Data Buffering: High Frequency Data Collection –Buffer high-speed process data –Integrate high-speed data values into the historian upon trigger Data Quality: Data Cleansing –Analyze high speed process data, identify suspect data –call routines to “cleanse” suspect data –recognize critical events that need to be passed on immediately.

7
Aggregation Detect pattern-based process data events (e.g. limit exceedence) in moving time windows and report the non-conformance immediately
 in moving time windows and report the non-conformance immediately.")
8
Web Server Log

9
Web Server

10
What is StreamInsight? Input Adapter Output Adapter StreamInsight Library Input Adapter Output Adapter Event Sources Devices, Sensors Web servers Event stores & Databases Stock ticker, news feeds Event stores & Databases Pagers & Monitoring devices KPI Dashboards, SharePoint UI Trading stations Event Targets StreamInsight Application Development public override void Start() { Produce(); } public override void Resume() { Produce(); } public void Produce() { while (true) { Enqueue(ref ev); } var result = from win in inputStream.TumblingWindow(TimeSpan.FromSeconds(10)) select new { avg = win.Avg(e => e.W) };
 { Produce(); } public override void Resume() { Produce(); } public void Produce() { while (true) { Enqueue(ref ev); } var result = from win in inputStream.TumblingWindow(TimeSpan.FromSeconds(10)) select new { avg = win.Avg(e => e.W) };.")
11
Demo: Twitter Feed analytics

12
Event data is already in the Cloud Why Event Processing in the Cloud? Event data is globally distributed Data is not local! Bring the processing to the data, not the data to the processing!

13
What is Austin? Rich temporal (StreamInsight) and sequential (Reactive) analytics models Dynamic, flexible query and data source management experience Turn key connectivity for platform data sources and sinks (SQL Azure, Windows Azure Table Storage) Integrated with Azure management portal and billing experiences Real time data collection from wide variety of connected devices (Servers, Tablets, Phones) Standards compliant endpoints (REST, XML, JSON) Securable data ingress with data enrichment and transformation (geo-tagging, etc) Multi-tenant Azure service with flexible, elastic capacity for collection and analytics Federated scale out collection and analytics Distributed service monitoring and tracing
 and sequential (Reactive) analytics models Dynamic, flexible query and data source management experience Turn key connectivity for platform data sources and sinks (SQL Azure, Windows Azure Table Storage) Integrated with Azure management portal and billing experiences Real time data collection from wide variety of connected devices (Servers, Tablets, Phones) Standards compliant endpoints (REST, XML, JSON) Securable data ingress with data enrichment and transformation (geo-tagging, etc) Multi-tenant Azure service with flexible, elastic capacity for collection and analytics Federated scale out collection and analytics Distributed service monitoring and tracing.")
14
Key Scenarios Capture and analyze vehicle telemetry, identify usage patterns Car diagnostics, GPS data Highly customizable analytics of web application usage & performance Connect with the end user experience Real time monitoring of large scale cloud infrastructure and services Distributed instrumentation and analytics for operations, management and SLA’s Real time visibility into your user’s experience for widely distributed mobile applications Instant feedback on quality of service, user satisfaction and usage patterns

15
Austin Architecture Network Layer Authentication Event Transformation Enrichment StreamInsight Engine Event-driven Queries Scale-out Logging, Tracing REST Endpoint Monitoring Service Management Service Analytics Application Event Schemas Analytics Queries Visualization Network Layer Other data sources SQL Azure Azure Storage

16
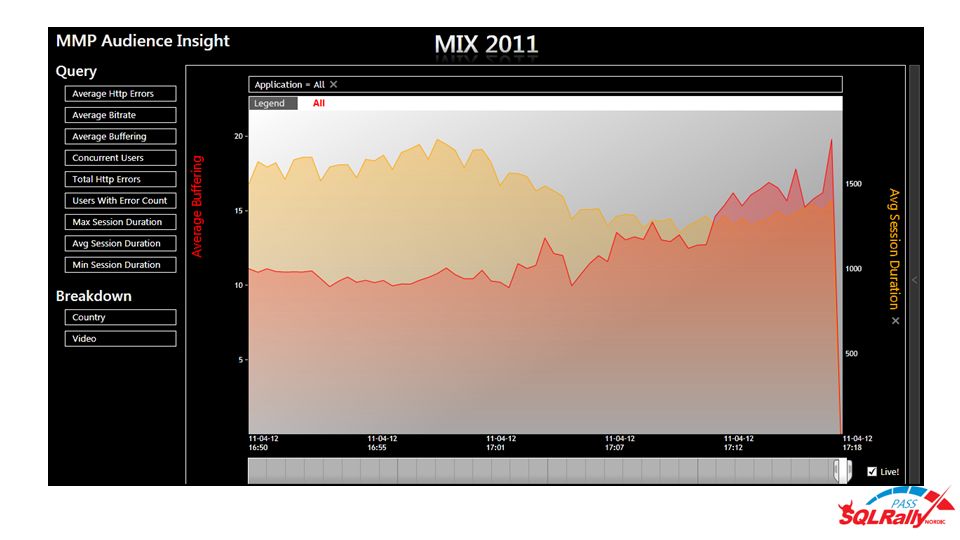
Customizing Austin Building an end to end video analytics application on Austin Austin focuses on the infrastructure so you can focus on your experience Implementing a custom analytics solution on top of Austin requires: –Defining custom data types and transformations –Defining analytics queries (in LINQ) –Creating visualization and interaction experiences on top of the analytics results Audience Insight is a forthcoming end-to-end service for tracking streaming video quality
 –Creating visualization and interaction experiences on top of the analytics results Audience Insight is a forthcoming end-to-end service for tracking streaming video quality")
17
Audience Insight Requirements Accept anonymous telemetry data from a variety of connected devices about video quality (feed quality, missing chunks, etc) Create reports and views of end-user experience health pivoted by geography & video source Provide multi-tenant data access and analytics (multiple end consumers)
 Create reports and views of end-user experience health pivoted by geography & video source Provide multi-tenant data access and analytics (multiple end consumers)")
18
Step 1: Data Collection and Transformation Define data formats and transformation Geocoding Define data enrichment (geocoding)
")
19
Step 2: Analytics <SqlAzureOutput ConnectionStringName = "SomeConnectionString" UseDateTime2="true" SqlIdentifier="ViewersByRegion_" SqlSchema="dbo" GroupFieldName="ApplicationId,CountryId,RegionId" /> Define queries Define destination var videoQualityByEdgeServer = from e in videoQualityStream group e by new { e.ApplicationId, e.CountryId } into edgeGroups from win in edgeGroups.TumblingWindow(windowSize) select new VideoQualityOutputByEdge { ApplicationId = edgeGroups.Key.ApplicationId, CountryId = edgeGroups.Key.CountryId, AvgPercentageBuffering = win.Avg(e => (double)e.BufferingSeconds / (double)e.SamplingFrequencySeconds), AvgBitrate = win.Avg(e => e.BitRate), UsersWithErrorCount = win.Sum(e => e.HttpErrorCount > 0 ? 1 : 0), AverageHttpErrors = win.Avg(e => e.HttpErrorCount), TotalHttpErrors = win.Sum(e => e.HttpErrorCount), ConcurrentViewers = win.CountUnique(e => e.VideoSessionId), };
, AverageHttpErrors = win.Avg(e => e.HttpErrorCount), TotalHttpErrors = win.Sum(e => e.HttpErrorCount), ConcurrentViewers = win.CountUnique(e => e.VideoSessionId), };.")
20
Audience Insight Implementation With this extension/configuration the Austin service will handle: –Data collection –Data transformation and enrichment –Event stream analytics –Publishing results to SQL Azure Audience Insight will pick up the data from SQL Azure and publish live/historical results via OData with a custom visualizer

22
Demo: Fleet Monitoring Shuttle Position Web Service Shuttle Position Web Service Austin SQL Azure Silverlight Client

23
THANK YOU! For attending this session and PASS SQLRally Nordic 2011, Stockholm

24
Moving into the Cloud Client App Input Adapter Output Adapter Queries, Management, Diagnostics Data In Data Out Remote Host in the Cloud

Similar presentations


 is the continuous and incremental processing of event streams from multiple sources based on declarative query.>")


 Amit Bansal (PeoplewareIndia.com)>")
 FROM ParkingLot WHERE type = ‘AUTO’ AND color = ‘RED’ SELECT COUNT(*) FROM ParkingLot WHERE type = ‘AUTO’ AND color = ‘RED’>")


 that are delivered as a service over the Internet. Cloud is the metaphor for.>")

 Platform.>")

