Download presentation
Presentation is loading. Please wait.

1
Learning objective: WALT: how order of reaction can be established WILF: rate equations for reactions based on data 07/06/2016 Rate of reaction = change in concentration of species/time taken Units: moldm -3 s -1 Rate = gradient of concentration against time graph Rate 1/time taken to produce known amount [A]/ moldm -3 Time (s)
![Learning objective: WALT: how order of reaction can be established WILF: rate equations for reactions based on data 07/06/2016 Rate of reaction = change in concentration of species/time taken Units: moldm -3 s -1 Rate = gradient of concentration against time graph Rate 1/time taken to produce known amount [A]/ moldm -3 Time (s)](http://images.slideplayer.com/34/10247314/slides/slide_1.jpg "Learning objective: WALT: how order of reaction can be established WILF: rate equations for reactions based on data 07/06/2016 Rate of reaction = change in concentration of species/time taken Units: moldm -3 s -1 Rate = gradient of concentration against time graph Rate 1/time taken to produce known amount [A]/ moldm -3 Time (s)")
2
Investigating rate of reaction Finding average rate – Disappearing cross – Change in light transmission – Volume gas – Change in mass – Reactant disappears Finding actual rate – Transmission (continuous/at regular intervals) – Gas volume at regular intervals – Mass (continuous/at regular intervals)
 – Gas volume at regular intervals – Mass (continuous/at regular intervals)")
3
Activity: To test collision theory For a reaction to occur reactants must collide With energy above the activation energy Energy too low: NO REACTION Energy > activation energy: REACTION

4
Variables? What variables are predicted by collision theory? Design an experiment to demonstrate one of the variables Draw and label a Maxwell-Boltzmann distribution to illustrate the outcome of the experiment

5
Terminology Rate = k[A] m [B] n a A + b B c C + d D Which is the stochiometric equation? Which is the rate equation? What is the rate constant? What is the order with respect to A? What is the order with respect to B? What is the overall order? Stochiometric equation Rate equation Orders with respect to [A] Orders with respect to [B] m+n Rate constant
![Terminology Rate = k[A] m [B] n a A + b B c C + d D Which is the stochiometric equation.](http://images.slideplayer.com/34/10247314/slides/slide_5.jpg "Which is the rate equation. What is the rate constant. What is the order with respect to A. What is the order with respect to B. What is the overall order. Stochiometric equation Rate equation Orders with respect to [A] Orders with respect to [B] m+n Rate constant.")
6
Determination of the order of a reaction

7
The principle Consider the reaction: x A + y B products Experiments show that the reaction rate can be related to the concentrations of the individual reactants by an equation of the form, Rate = k[A] m [B] n This expression is known as the rate equation. m and n are experimentally determined constants (usually equal to 0, 1 or 2) and k is the rate constant for the reaction. The index m is called the order of reaction with respect to A, and n is the order of the reaction with respect to B. The overall order s the sum of the individual orders (i.e. m + n).
![The principle Consider the reaction: x A + y B products Experiments show that the reaction rate can be related to the concentrations of the individual reactants by an equation of the form, Rate = k[A] m [B] n This expression is known as the rate equation.](http://images.slideplayer.com/34/10247314/slides/slide_7.jpg "m and n are experimentally determined constants (usually equal to 0, 1 or 2) and k is the rate constant for the reaction. The index m is called the order of reaction with respect to A, and n is the order of the reaction with respect to B. The overall order s the sum of the individual orders (i.e. m + n)..")
8
The reaction The reaction you will be investigating involves hydrogen peroxide and iodide ions in acid solution: H 2 O 2 (aq) + I - (aq) + H + (aq) 2 H 2 O (l) + I 2 (aq) The rate equation for this reaction can be written as: Rate = k[H 2 O 2 ] [I - ] [H + ] The order of reaction with respect to one reactant can be investigated by having the other reactants present in large excess so that their concentration remains effectively constant throughout the experiment. In this reaction the order with respect to H 2 O 2 will be investigated by using very much larger [I - ] and [H + ]. This technique gives us a pseudo- rate equation: Rate = k’[H 2 O 2 ] where k’ includes [I - ] and [H + ].
![The reaction The reaction you will be investigating involves hydrogen peroxide and iodide ions in acid solution: H 2 O 2 (aq) + I - (aq) + H + (aq) 2 H 2 O (l) + I 2 (aq) The rate equation for this reaction can be written as: Rate = k[H 2 O 2 ] [I - ] [H + ] The order of reaction with respect to one reactant can be investigated by having the other reactants present in large excess so that their concentration remains effectively constant throughout the experiment.](http://images.slideplayer.com/34/10247314/slides/slide_8.jpg "In this reaction the order with respect to H 2 O 2 will be investigated by using very much larger [I - ] and [H + ]. This technique gives us a pseudo- rate equation: Rate = k’[H 2 O 2 ] where k’ includes [I - ] and [H + ]..")
9
The iodine clock The reaction involves hydrogen peroxide reacting with acidified potassium iodide in the presence of small amounts of sodium thiosulphate and starch. As soon as the iodine is produced it reacts with thiosulphate ions forming iodide ions: I 2 (aq) + 2 S 2 O 3 2- (aq) 2 I - (aq) + S 4 O 6 2- (aq) When the iodine produced in the reaction exceeds the amount of sodium thiosulphate originally present it reacts with the starch and the solution turns blue. The amount of sodium thiosulphate is known, therefore, the amount of I 2 produced can be calculated and hence the amount of H 2 O 2 that has reacted. Knowing the original amount of H 2 O 2, we can calculate the [H 2 O 2 ] at the time the blue colour appears. The value [H 2 O 2 ] at different times can be used to find the order with respect to H 2 O 2.
 + 2 S 2 O 3 2- (aq) 2 I - (aq) + S 4 O 6 2- (aq) When the iodine produced in the reaction exceeds the amount of sodium thiosulphate originally present it reacts with the starch and the solution turns blue. The amount of sodium thiosulphate is known, therefore, the amount of I 2 produced can be calculated and hence the amount of H 2 O 2 that has reacted. Knowing the original amount of H 2 O 2, we can calculate the [H 2 O 2 ] at the time the blue colour appears. The value [H 2 O 2 ] at different times can be used to find the order with respect to H 2 O 2..")
10
Procedure NOTE: EYE PROTECTION MUST BE WORN 1.Fill a burette with 0.05 mol dm -3 Na 2 S 2 O 3 (aq). 2.Put 450 cm 3 distilled water in a 1 dm 3 beaker and add 25 cm 3 H 2 SO 4, 1 cm 3 starch solution and 15.0 cm 3 KI. Finally add 2 cm 3 S 2 O 3 2- (aq) from the burette. 3.Start the reaction by rapidly adding 10 cm 3 0.1 mol dm -3 H 2 O 2 (aq) from a pipette (use a safety filler). Stir during the addition. 4.Start timing when HALF the H 2 O 2 has been added. Why? 5.When the I 2 produced in the reaction is in excess of the added S 2 O 3 2-, a blue colour will appear. Quickly, note the time, add a further 2 cm 3 S 2 O 3 2- (aq) and the blue colour will disappear. 6.Note the time when the blue colour reappears and add another 2 cm 3 S 2 O 3 2- (aq). 7.Continue until 8-10 readings have been obtained.
 from the burette. 3.Start the reaction by rapidly adding 10 cm mol dm -3 H 2 O 2 (aq) from a pipette (use a safety filler). Stir during the addition. 4.Start timing when HALF the H 2 O 2 has been added. Why. 5.When the I 2 produced in the reaction is in excess of the added S 2 O 3 2-, a blue colour will appear. Quickly, note the time, add a further 2 cm 3 S 2 O 3 2- (aq) and the blue colour will disappear. 6.Note the time when the blue colour reappears and add another 2 cm 3 S 2 O 3 2- (aq). 7.Continue until 8-10 readings have been obtained..")
11
Think about... H 2 O 2 (aq) + I - (aq) + H + (aq) 2 H 2 O (l) + I 2 (aq) I 2 (aq) + 2 S 2 O 3 2- (aq) 2 I - (aq) + S 4 O 6 2- (aq) Why does [I - ] remain constant throughout the experiment (Hint: Look at the two equations) Why does the time interval between the appearances of blue colour increase? Why is it important to stir during the addition of hydrogen peroxide?
 + I - (aq) + H + (aq) 2 H 2 O (l) + I 2 (aq) I 2 (aq) + 2 S 2 O 3 2- (aq) 2 I - (aq) + S 4 O 6 2- (aq) Why does [I - ] remain constant throughout the experiment (Hint: Look at the two equations) Why does the time interval between the appearances of blue colour increase. Why is it important to stir during the addition of hydrogen peroxide .")
12
Data The [H 2 O 2 ] is most conveniently expressed in terms of volume of 0.05 mol dm -3 Na 2 S 2 O 3 added. Therefore he initial concentration of H 2 O 2 is equal to the result of the titration (t). If [H 2 O 2 ] was exactly 0.1 mol dm -3 this will equal 40 cm 3. The [H 2 O 2 ] when the first blue colour appeared will be 2 cm 3 less than the original concentration (t-2), and so on: Time [H 2 O 2 ] /seconds / cm 3 Na 2 S 2 O 3 t t-2 t-4 t-6 t-8 t-10 t-12 t-14 t-16 t-20
![Data The [H 2 O 2 ] is most conveniently expressed in terms of volume of 0.05 mol dm -3 Na 2 S 2 O 3 added.](http://images.slideplayer.com/34/10247314/slides/slide_12.jpg "Therefore he initial concentration of H 2 O 2 is equal to the result of the titration (t). If [H 2 O 2 ] was exactly 0.1 mol dm -3 this will equal 40 cm 3. The [H 2 O 2 ] when the first blue colour appeared will be 2 cm 3 less than the original concentration (t-2), and so on: Time [H 2 O 2 ] /seconds / cm 3 Na 2 S 2 O 3 t t-2 t-4 t-6 t-8 t-10 t-12 t-14 t-16 t-20.")
13
Graphs Time/s

14
Graphs [H 2 O 2 ]/ml Rate/mls -1 Rate = gradient of time against concentration curve
![Graphs [H 2 O 2 ]/ml Rate/mls -1 Rate = gradient of time against concentration curve](http://images.slideplayer.com/34/10247314/slides/slide_14.jpg "Graphs [H 2 O 2 ]/ml Rate/mls -1 Rate = gradient of time against concentration curve")
15
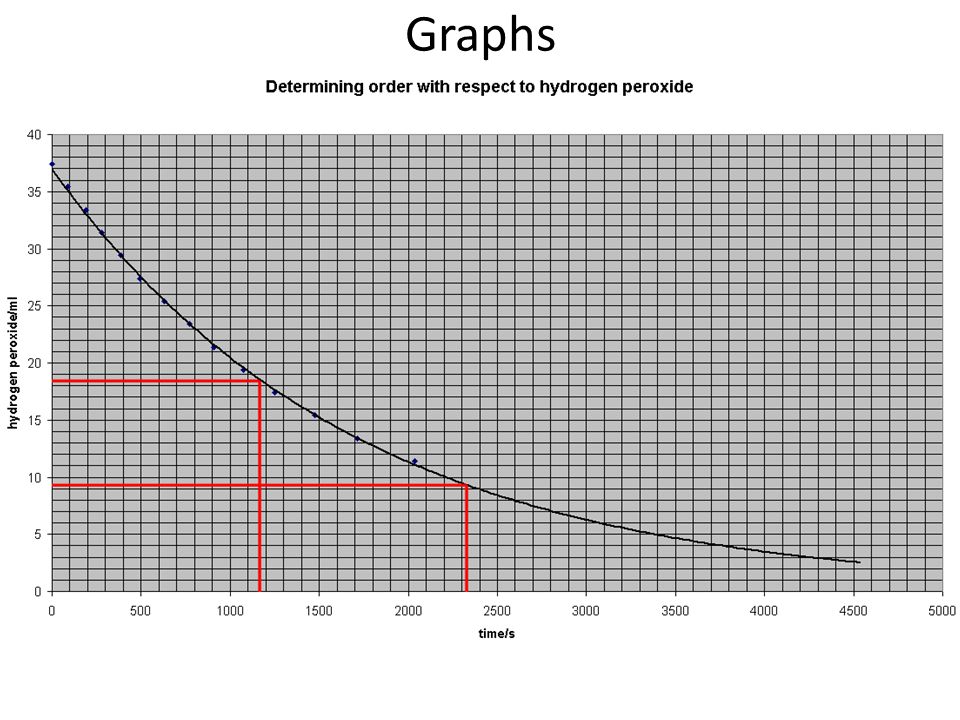
Graphs

17
Establishing order of reaction: If zero order: Rate = -d[H 2 O 2 ]/dt = k’[H 2 O 2 ] 0 [H 2 O 2 ] = -k’t + [H 2 O 2 ] 0 If the reaction is zero order w.r.t. H 2 O 2 then a plot of [H 2 O 2 ] against time will be a straight line. If first order: Rate = -d[H 2 O 2 ]/dt = k’[H 2 O 2 ] 1 ln([H 2 O 2 ] 0 /[H 2 O 2 ]) = k’t If the reaction is first order a plot of ln([H 2 O 2 ] 0 /[H 2 O 2 ]) {or lg([H 2 O 2 ] 0 /[H 2 O 2 ])} against time will be a straight line. OR A plot of [H 2 O 2 ] against time will be a curve with a constant half life If second order: Rate = -d[H 2 O 2 ]/dt = k’[H 2 O 2 ] 2 1/[H 2 O 2 ] = k’t + 1/[H 2 O 2 ] 0 If the reaction is second order a plot of 1/[H 2 O 2 ] against time will be a straight line. To find the order of the reaction with respect to hydrogen peroxide plot [H 2 O 2 ] against time and 1/[H 2 O 2 ] against time
![Establishing order of reaction: If zero order: Rate = -d[H 2 O 2 ]/dt = k’[H 2 O 2 ] 0 [H 2 O 2 ] = -k’t + [H 2 O 2 ] 0 If the reaction is zero order w.r.t.](http://images.slideplayer.com/34/10247314/slides/slide_17.jpg "H 2 O 2 then a plot of [H 2 O 2 ] against time will be a straight line. If first order: Rate = -d[H 2 O 2 ]/dt = k’[H 2 O 2 ] 1 ln([H 2 O 2 ] 0 /[H 2 O 2 ]) = k’t If the reaction is first order a plot of ln([H 2 O 2 ] 0 /[H 2 O 2 ]) {or lg([H 2 O 2 ] 0 /[H 2 O 2 ])} against time will be a straight line. OR A plot of [H 2 O 2 ] against time will be a curve with a constant half life If second order: Rate = -d[H 2 O 2 ]/dt = k’[H 2 O 2 ] 2 1/[H 2 O 2 ] = k’t + 1/[H 2 O 2 ] 0 If the reaction is second order a plot of 1/[H 2 O 2 ] against time will be a straight line. To find the order of the reaction with respect to hydrogen peroxide plot [H 2 O 2 ] against time and 1/[H 2 O 2 ] against time.")
18
Order – from continuous measurement 0 order1 st order Constant half life (t 1/2 ) amount time
 amount time")
19
Order zero order Rate = k [A] 0 Rate = k Units Rate: moldm -3 s -1 k: moldm -3 s -1 Zero order rate constant always has units of moldm -3 s -1 first order Rate = k[A] 1 Rate = k[A] Units Rate: moldm -3 s -1 []: moldm -3 k: s -1 First order rate constant always has units of s -1
![Order zero order Rate = k [A] 0 Rate = k Units Rate: moldm -3 s -1 k: moldm -3 s -1 Zero order rate constant always has units of moldm -3 s -1 first order Rate = k[A] 1 Rate = k[A] Units Rate: moldm -3 s -1 []: moldm -3 k: s -1 First order rate constant always has units of s -1](http://images.slideplayer.com/34/10247314/slides/slide_19.jpg "Order zero order Rate = k [A] 0 Rate = k Units Rate: moldm -3 s -1 k: moldm -3 s -1 Zero order rate constant always has units of moldm -3 s -1 first order Rate = k[A] 1 Rate = k[A] Units Rate: moldm -3 s -1 []: moldm -3 k: s -1 First order rate constant always has units of s -1")
Similar presentations

>")


