Download presentation
Presentation is loading. Please wait.

1
On-Site Improvement via Data Coaching 2009-10 Office of Accountability School and Program Improvement Title 1 Funded Programs Saint Paul Public Schools August 2010

2
Introduction Through a collaborative effort School and Program Improvement and Title 1 leveraged their respective resources to refine and implement a comprehensive on-site data coaching design. The purpose of the initiative was as follows: To build capacity for schools to become truly data driven. To build infrastructure for school improvement system. To integrate accountability to School-wide Comprehensive and Continuous Improvement Plans (SCIPs), and To support the two district student achievement goals Reading -10 percentage point increase, all grades and all groups Math - 10 percentage point increase, all grades and all groups
, and To support the two district student achievement goals Reading -10 percentage point increase, all grades and all groups Math - 10 percentage point increase, all grades and all groups.")
3
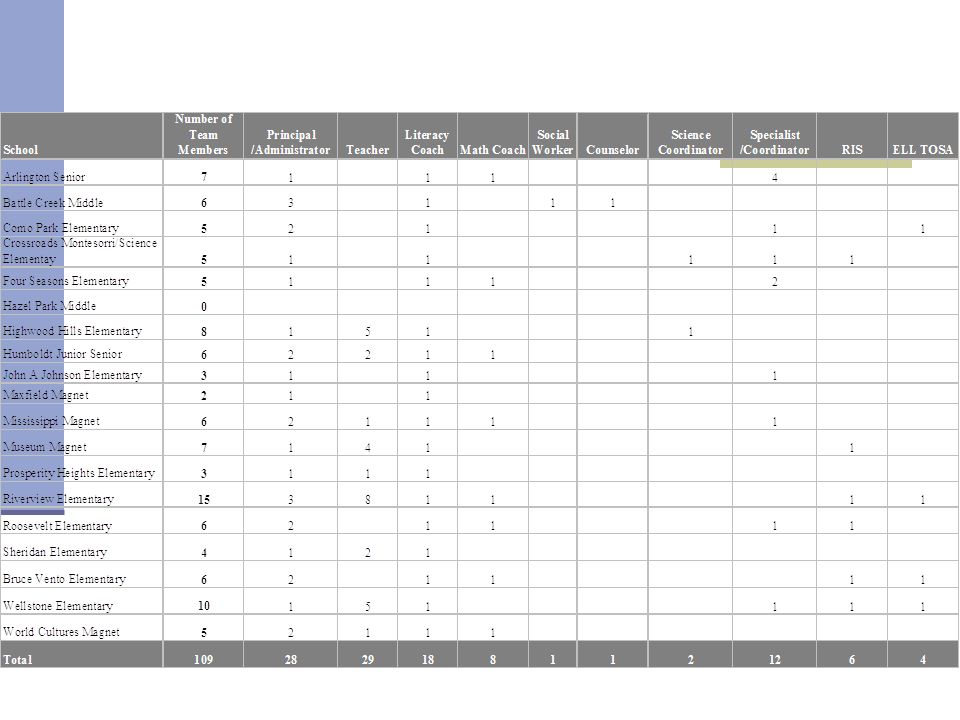
Selection of Participating Schools All other Title I schools in need of AYP assistance were encouraged to participate, and, priority was given to schools identified by their Executive Director. This opportunity was not open to schools currently participating in Success In Sight. After the e-mail was sent, a meeting with the then Executive Directors and Chief of Schools to identify schools for assistance. As a result of the two processes: Five (5) schools volunteered and received a coach: Crossroads Science/Montessori Elementary, Highwood Hills Elementary, Prosperity Heights Elementary, Riverview Elementary, and John A Johnson Elementary Two (2) schools volunteered and did not receive a coach: Farnsworth/Cleveland and Frost Lake Elementary Eleven (11) schools did not volunteer and received a coach: Four Seasons Elementary, Paul & Sheila Wellstone Elementary, Sheridan Elementary, World Cultures Magnet, Como Park Elementary, Museum Magnet, Battle Creek Middle School, Hazel Park Academy, Arlington High School and Humboldt Secondary Complex, and Roosevelt Elementary. Three schools (3) automatically received a coach because they were audited during the school year 2008-09: Maxfield Magnet, Bruce Vento Elementary, and Mississippi Creative Arts Magnet.
 schools volunteered and received a coach: Crossroads Science/Montessori Elementary, Highwood Hills Elementary, Prosperity Heights Elementary, Riverview Elementary, and John A Johnson Elementary Two (2) schools volunteered and did not receive a coach: Farnsworth/Cleveland and Frost Lake Elementary Eleven (11) schools did not volunteer and received a coach: Four Seasons Elementary, Paul & Sheila Wellstone Elementary, Sheridan Elementary, World Cultures Magnet, Como Park Elementary, Museum Magnet, Battle Creek Middle School, Hazel Park Academy, Arlington High School and Humboldt Secondary Complex, and Roosevelt Elementary. Three schools (3) automatically received a coach because they were audited during the school year : Maxfield Magnet, Bruce Vento Elementary, and Mississippi Creative Arts Magnet..")
4
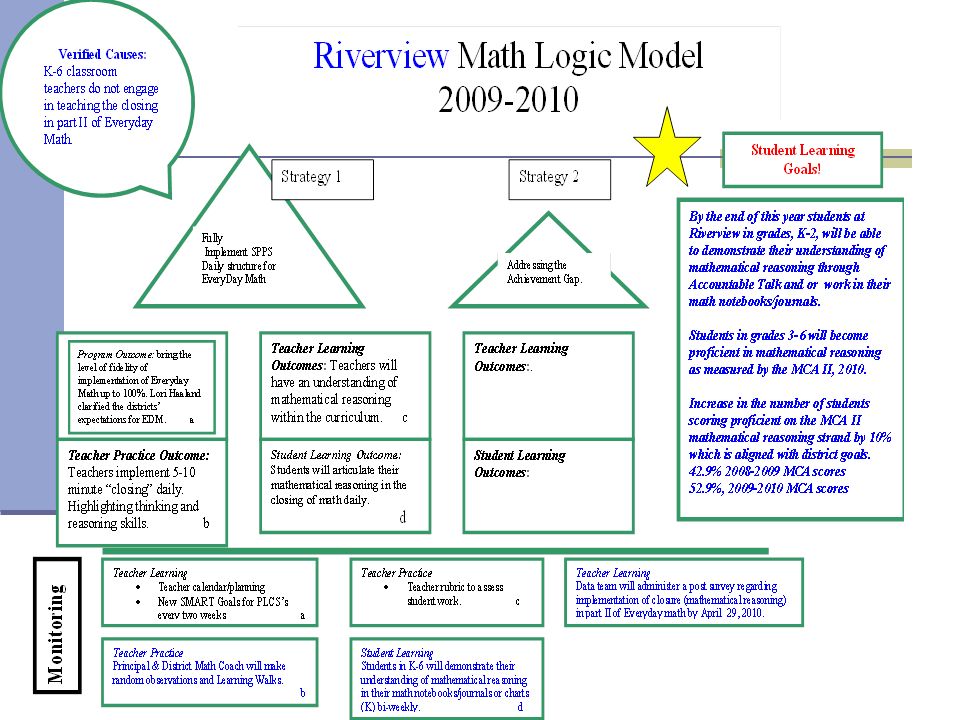
Data Coaching Design Building on the work of Nancy Love (2008), the data coaching initiative was designed to increase the school staff’s data literacy skills. The outcome for the data coaching initiative was as follows: By the end of academic year 2010 all teams will be “data literate”—that is, able to complete the following tasks as evidenced in their School-wide Continuous Improvement Plan and the documentation of the improvement work during 2009-10: engage in a four-phase dialogue regarding their data; understand how to examine a variety of data to continuously improve instruction; understand how to examine data by the following levels: aggregate, disaggregate, strand, item-level and student work; understand appropriate use of trend data; distinguish meaningful difference when examining data for improvement; create student learning goals based on analysis of data; and implement a monitoring plan to examine progress towards learning goals.

5
SessionCurriculum TopicDescription 1Overview and team building Data team responsibilities Ice breaker Using data process overview 2The Using Data Process Culturally Proficient Leadership Core Values of Equity Using Data to Sort/Serve Students Assessment Pyramid Types of Data Data Driven Dialogue 3Drill Down Analysis MCAII data Aggregate Data Disaggregate Data MCA Strand Data 4Drill Down Analysis Assessment (MAP, Mondo, etc.) 5Drill Down Analysis Assessment (MAP, Mondo, etc.) 6Student learning problem Verify the causes of the problem Generate solutions Build a logic model to implement and monitor the solutions Student learning problem statement? Verify Causes Tree 7Review and Analysis Monitor logic model Assessment (MAP, Mondo, etc.) 8Review and Analysis Monitor logic model Assessment (MAP, Mondo, etc.) 9 Review and Analysis Wrap up Monitor logic model Assessment (MAP, Mondo, etc.)
 8Review and Analysis Monitor logic model Assessment (MAP, Mondo, etc.) 9 Review and Analysis Wrap up Monitor logic model Assessment (MAP, Mondo, etc.).")
6
Roll Out Before the selection of participants, SPI advertised the data coaching initiative via SPPS district-wide communication mediums including e-mail and the Bridge. Once participants were selected and data coaches assigned, each data coach went to their assigned school to meet with the principal and discuss the process and expectations and to determine a timeline for beginning the initiative. Once the principal identified the members of the building teams, the activity could begin. After that each school progressed according to the curriculum.

8
Highlights The individual coaches quickly adapted to the hybrid skill set of a data coach. As this initiative was relatively new, we had not built up a cadre of experienced and well-suited staff who could immediately assume the roll of a data coach. In addition, we also had not established a vision for data literacy and data-driven decision making in the district. Nonetheless, the individuals who assumed the roles as data coaches remained flexible and spent a great deal of time intentionally growing into the role.

9
Highlights (continued) With a few exceptions, schools were very good regarding meeting and participating in the work. Three schools made extremely noticeable progress becoming exemplary partners in the initiative: Prosperity Heights Elementary, Como Park Elementary, and Riverview Elementary. The three schools had high commitment, particularly the leadership, to the initiative and most of all they found a way to articulate the learning from the team into professional development for staff.

10
“
11
Challenges The curriculum as designed did not fit neatly with the time frame allotted for learning. We found that most teams needed to spend at a minimum two hours per session and that meeting more frequently than once a month when needed helped the initiative to integrate into the school’s culture. Those teams that stuck to the minimum meeting schedule did not experience the greatest implementation of the initiative.

12
Challenges (continued) In some cases, such as Bruce Vento Elementary, our curriculum design was in direct conflict with what was already happening at the building. This led the team to reflect on school culture and adapt the initiative curriculum to meet the needs of the building. While it was structural difference in the case of Vento, in other cases it was finding appropriate data or creating data points for the teams to examine

13
Conclusion Overall, the first year of the data coaching initiative went well. Several schools were supported in increasing their data literacy, the data coaches themselves increased their skill set to be able to better support schools in the future and at least three schools benefitted greatly from the work. In, planning for 2010-11 we will increase the flexibility of the content, clarify the roles of data coaches and monitor the clarifications, articulate the needs of the school before beginning support strategies and adjust the expectations regarding the minimum amount of time necessary to impact the building.

Similar presentations
>")


>")


