Download presentation
Presentation is loading. Please wait.

1
Estimating Deer Populations The Math Connection

2
Goals for this Lesson Distinguish the difference between a wildlife population census and an index. Define population monitoring Use pellet group survey data to calculate deer density per square mile Relate deer density to the health of the forest and deer population.

3
Background In order to manage white-tailed deer populations wildlife biologists need to know the deer population in a given area. Biologists need to know if populations are increasing, decreasing, or are stable.

4
Census One way to determine deer populations is to perform a census. A census is an exact count of every animal in a given area at one time.

5
Sampling Often it is not possible to census the entire deer population. In this case biologists may use a sampling method. Sampling is not an exact count. It is an estimate based on studying just part of the population.

6
Index When it is not necessary to know the exact number of deer in an area a population index can be used. An index does not result in an exact count of the animals that live in an area it just tells whether there are more or fewer animals than the last time it was checked. An index tells us how abundant animals are by counting signs.

7
Monitoring Population monitoring involves using a census, sample, or index to determine how populations are changing over time.

9
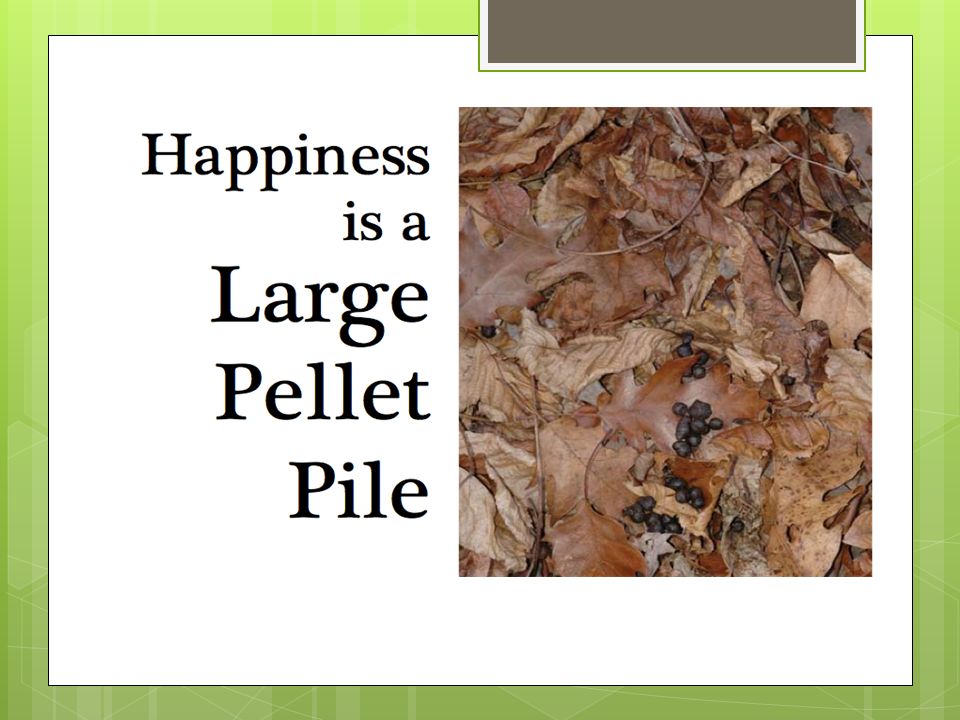
Animal Signs Many types of animal signs can be used as long as each animal leaves them in roughly the same amount. For deer, counts of their droppings can be used since each animal leaves them in roughly the same amount.

13
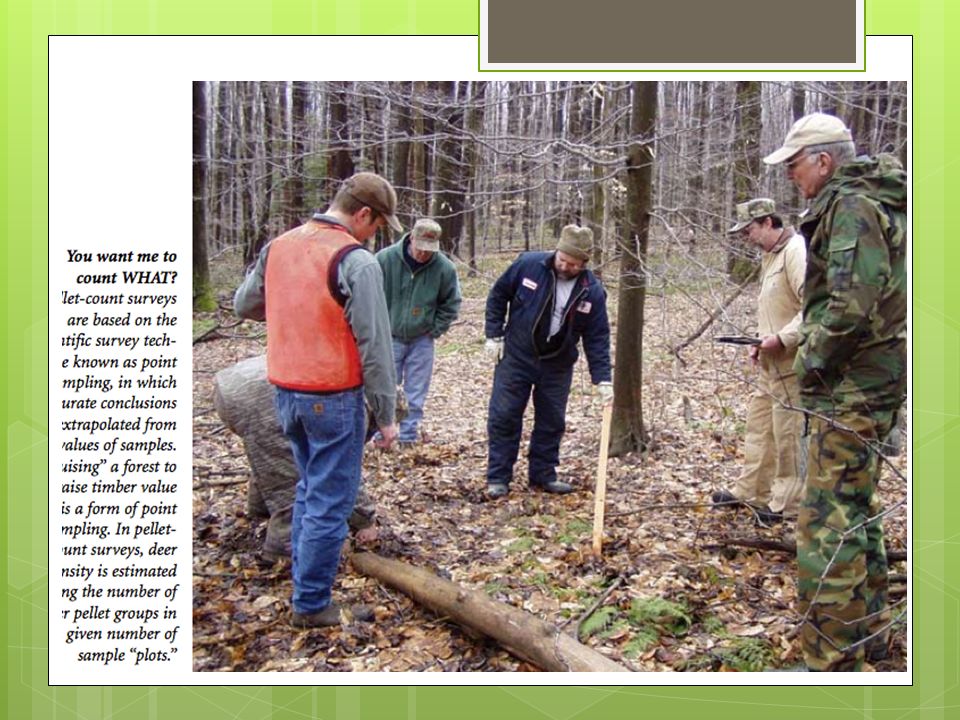
Researchers Go into the woods 24 hours after a snowfall Travel a straight line and stop at regular intervals to count groups of deer droppings within a circle of a given radius Calculate the total area in their sample plots and divide by the average number of pellet groups that a deer makes per day

14
Leaf-off Date Since wildlife biologists cannot stay on call for the next snowstorm, they now rely on the date of autumn “leaf-off” as the starting date. Leaf-off date is the date in the fall after which the bulk of the habitat’s leaves have fallen. It is assumed that deer pellet groups deposited before this date that haven’t yet decomposed will be covered by leaves and will be missed by your spring survey crew. Pellet groups deposited after this date will be visible to observers and will be counted. In central Pennsylvania, they use November 15. The leaf-off date for any location can easily be determined by keeping a watchful eye each fall and marking the date on a calendar.

15
Pellet Group Counts For this activity students will be using a survey method called Pellet Group Counts Pellet counts are a population index that represents average deer density over winter. Up north, deer pellet counts must be conducted after snow melt but before spring green up. Surveys should cover as large an area as possible; preferably a deer’s home range (1 square mile or 640 acres). Survey area size can be adjusted dependent upon time constraints and woodlot size.
. Survey area size can be adjusted dependent upon time constraints and woodlot size..")
16
Calculating Deer Density Using Pellet-Count Results

17
Calculations:

18
Survey Data Analysis Ten plots, each 1/100 acre in size, are cleared of pellets. One hundred days later, plots are revisited and pellet- groups located on plots are counted. Assume that a total of 13 groups are counted on the 10 plots. Defecation rate established as approximately 13/day In groups, calculate: Pellet groups per acre: Deer days per acre: Deer per acre: Deer per square mile:

19
How do we know how many times deer “drop” per day? Past research and observation of captive deer populations have led biologists to an accepted value of 25 pellet groups per day. This is known as the pellet deposit rate (PDR).
..")
20
Whose views on deer management should be recognized? As a group, please name them. What do you think their viewpoints would be? How might they differ from recreational hunters? Are their concerns being taken into consideration when deer management decisions are being made?

21
Do deer populations have an impact on your quality of life? If so, how?

Similar presentations


 Ungulate Winter Range North Island-Central Coast Mid Coast TSA.>")


 2.Variability within the stand 3.Budget limitations Sampling Intensity.>")


 recorded for April and.>")