Download presentation
Presentation is loading. Please wait.

1
SNO + SNO+ Steve Biller, Oxford University

3
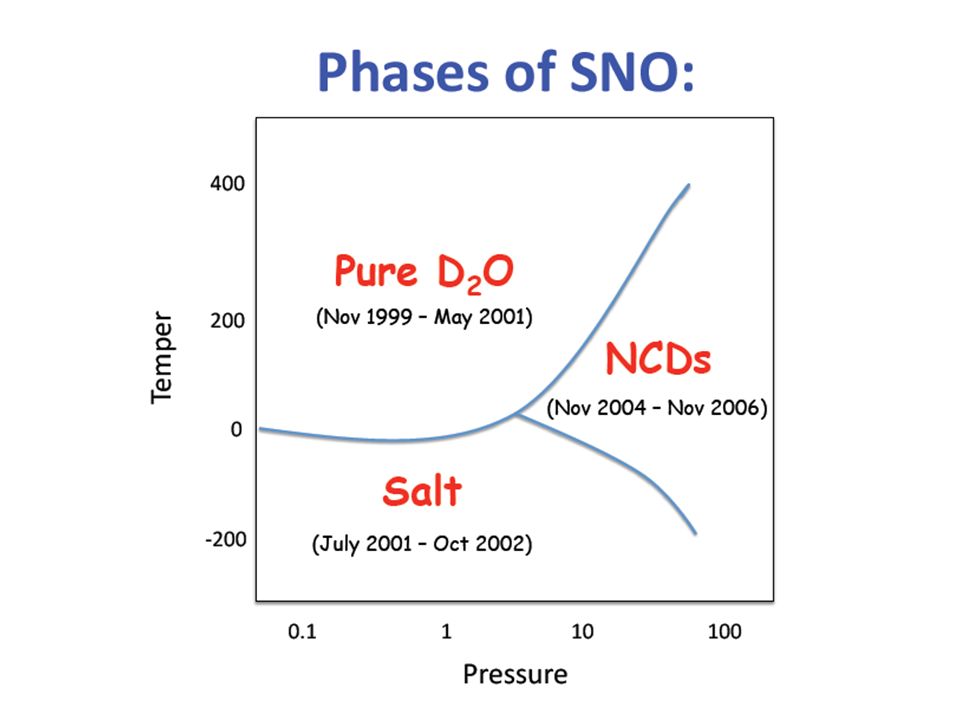
total SSM June 2001 (indirect) April 2002 (direct) (unconstrained CC spectrum) Sept 2003 (salt - unconstrained) May 2008 (indep. NCD measurement)
.")
5
Energy β 14 R3R3 cos θ sun “Contamination” Normalization (neutrons, others) PMT - distributions Old (D2O,salt) Scale: 1.2% Resn: 4.5, 3.4% Electron: 0.85% Fid Vol: 3% Ang Resn: 16% Ncap: >2% New < 0.5% < 2% 0.24 % < 1% 11% 1.2% Reduce Systematic Uncertainties
 PMT - distributions Old (D2O,salt) Scale: 1.2% Resn: 4.5, 3.4% Electron: 0.85% Fid Vol: 3% Ang Resn: 16% Ncap: >2% New < 0.5% < 2% 0.24 % < 1% 11% 1.2% Reduce Systematic Uncertainties")
6
Ideal (and correct!) Way To Propagate Uncertainties: “Float” uncertainties as variable parameters in Likelihood fit, appropriately constrained by any independently determined bounds. “Float” uncertainties as variable parameters in Likelihood fit, appropriately constrained by any independently determined bounds. In 4 dimensions with >50 parameters and limited MC statistics for PDFs ?! Two Approaches:

7
1) Float Dominant Systematics via a “Brute Force” Iterative Scan of the Likelihood Space (shift & smear the rest)
 Float Dominant Systematics via a Brute Force Iterative Scan of the Likelihood Space (shift & smear the rest)")
8
2) Colonel Estimated PDFs Kernel
 Colonel Estimated PDFs Kernel")
9
Approach is very (prohibitively) CPU intensive … so don’t use CPUs!!
 CPU intensive … so don’t use CPUs!!")
10
8 B Flux Result

11
NC = 5.140 +4.0 -3.8 % (x10 6 cm -2 s -1 ) 8 B Flux Result
 8 B Flux Result")
12
NC = 5.140 +4.0 -3.8 % (x10 6 cm -2 s -1 ) J. N. Bahcall, A. M. Serenelli, and S. Basu, AstroPhys. J. 621, L85 (2005)
.")
13
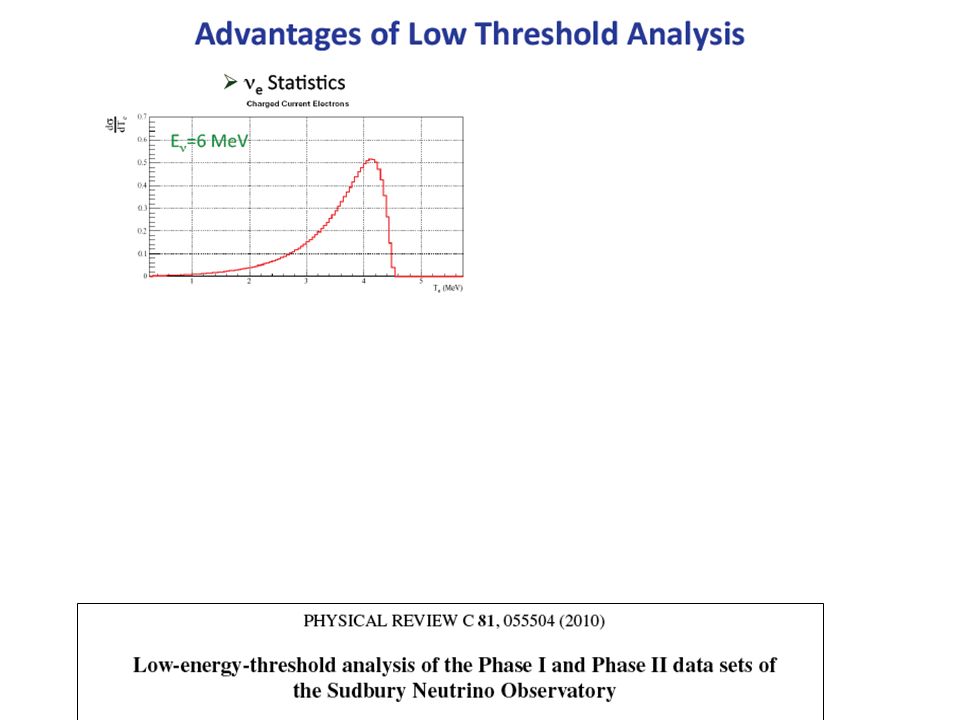
CC Recoil-Electron Spectrum

14
Previous Oscillation AnalysisNew Oscillation Analysis (LETA) SNO PRL 2008: Phase I + Phase II + Phase III LETA paper 2010: LETA joint-phase fit + Phase III
 SNO PRL 2008: Phase I + Phase II + Phase III LETA paper 2010: LETA joint-phase fit + Phase III")
15
LETA paper 2010: LETA joint-phase fit + Phase III + all solar expts + KamLAND 3-flavor analysis: Best-fit: sin 2 13 = 0.02 +0.02 -0.016 sin 2 13 < 0.057 (95% C.L.) 3 model Solar + KamLAND 3-flavor Overlay
 3 model Solar + KamLAND 3-flavor Overlay")
18
Physics with Liquid Scintillator o “Invisible” modes of nucleon decay unique sensitivity with initial water data o Neutrinoless double beta decay various isotopes possible o Low energy solar neutrinos pep, CNO, 8 B and potentially 7 Be & pp o Geo-neutrinos unmatched o 240 km baseline reactor neutrino oscillation m 2 resolution comparable to KamLAND o Supernova neutrinos major player

19
Oxford University Sussex University Leeds University Liverpool University Sheffield University QMUL University of Pennsylvania University of Washington Black Hills State University Armstrong Atlantic University University of North Carolina Brookhaven National Lab Queen’s University Laurentian University University of Alberta TRIUMF SNOLAB TU Dresden LIP Lisbon

20
Now part of larger SNOLAB major underground science facility. Nigel Smith is now the director.

21
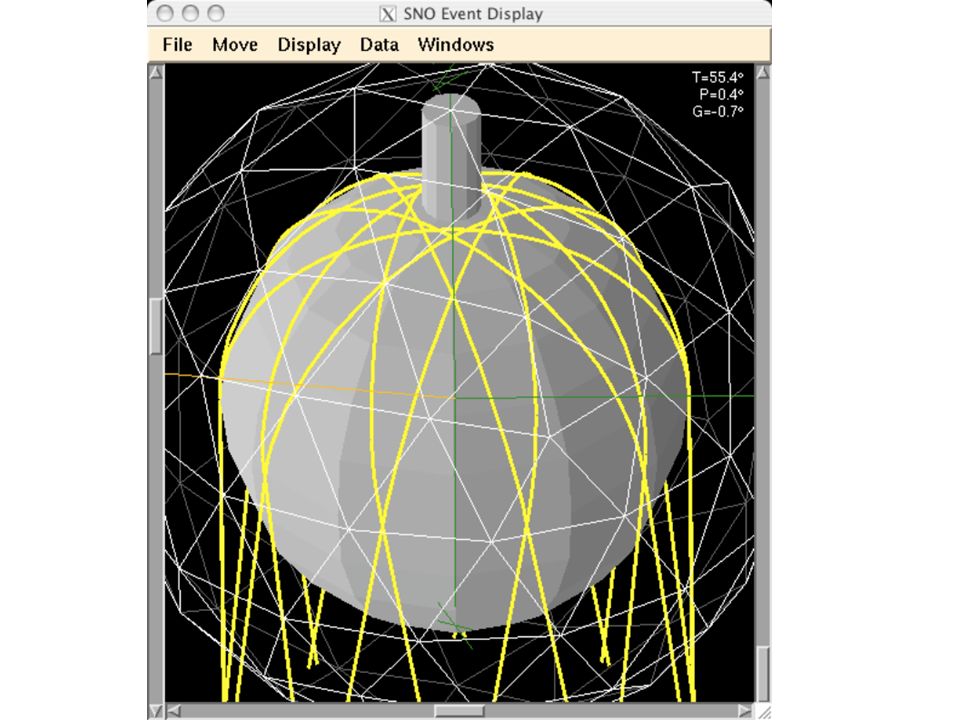
SNO+ AV Hold Down Existing AV Support Ropes

22
SNO+ AV Hold Down AV Hold Down Ropes Existing AV Support Ropes

26
Electronics refurbishment Improved cover-gas system New glovebox Repair of liner Re-sanding of acrylic vessel Overhaul of software design New calibration systems New purification systems Replacement of pipes

27
Acrylic Vessel Cleaning and Sanding Platforms

29
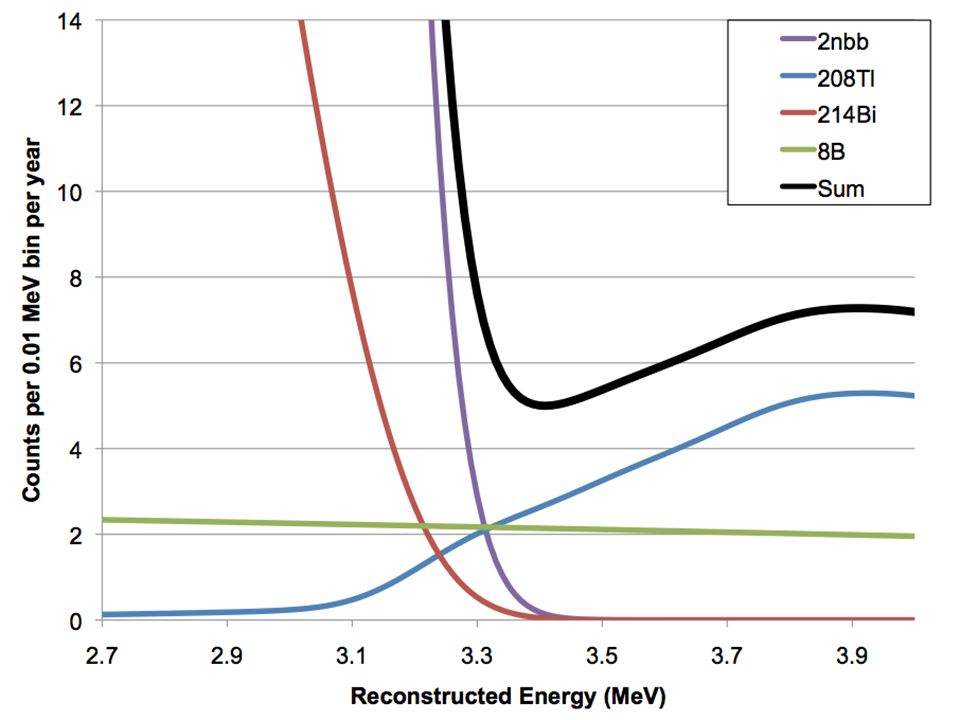
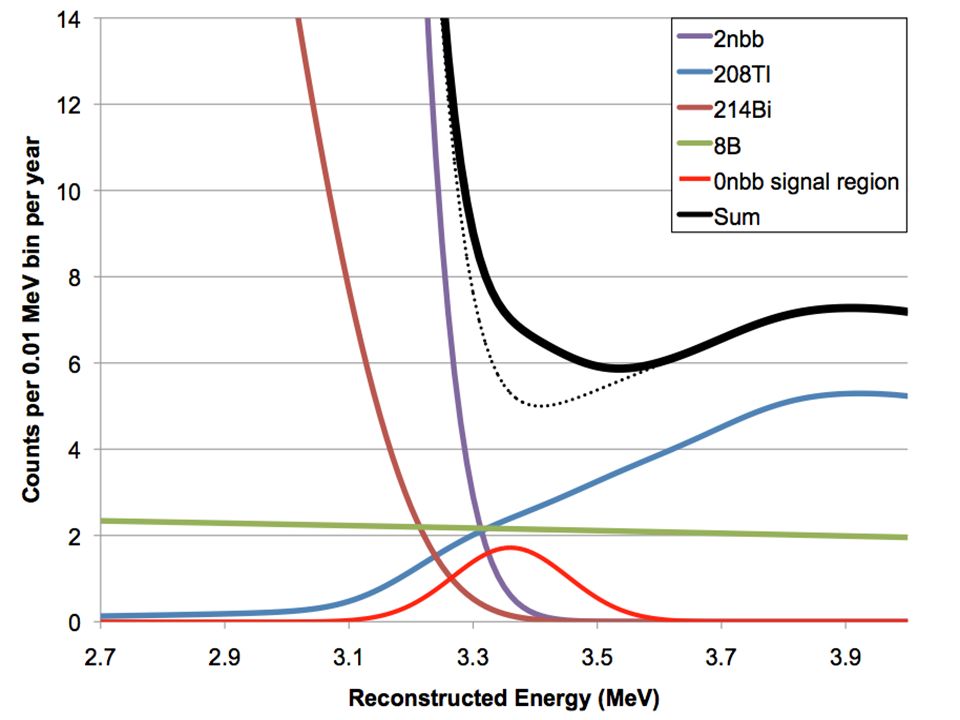
Neutrinoless Double -Decay

32
Light Output and Concentration “extremes”

33
“Ideal” Statistical Optimisation

34
How do you firmly establish whether a possible signal is actually 0 2 Two methods: 1) Redundancy 2) Redundancy Different isotopes with signals predicted at different energies, with different backgrounds, and different signal rates that scale correctly with the corresponding matrix elements.
 Redundancy 2) Redundancy Different isotopes with signals predicted at different energies, with different backgrounds, and different signal rates that scale correctly with the corresponding matrix elements.")
35
350 300 250 200 150 100 50 0 2010 2011 2012 2013 2014 2015 2016 2017 2018 2019 2020 m (meV)
")
36
350 300 250 200 150 100 50 0 2010 2011 2012 2013 2014 2015 2016 2017 2018 2019 2020 CUORE GERDA I GERDA II EXO KAMLAND SUPER NEMO SNO+ II ? SUPER NEMO (demonstrator) m (meV)
 m (meV).")
37
Towards SNO++ 150 Nd enrichment Nanoparticles Other Isotopes

38
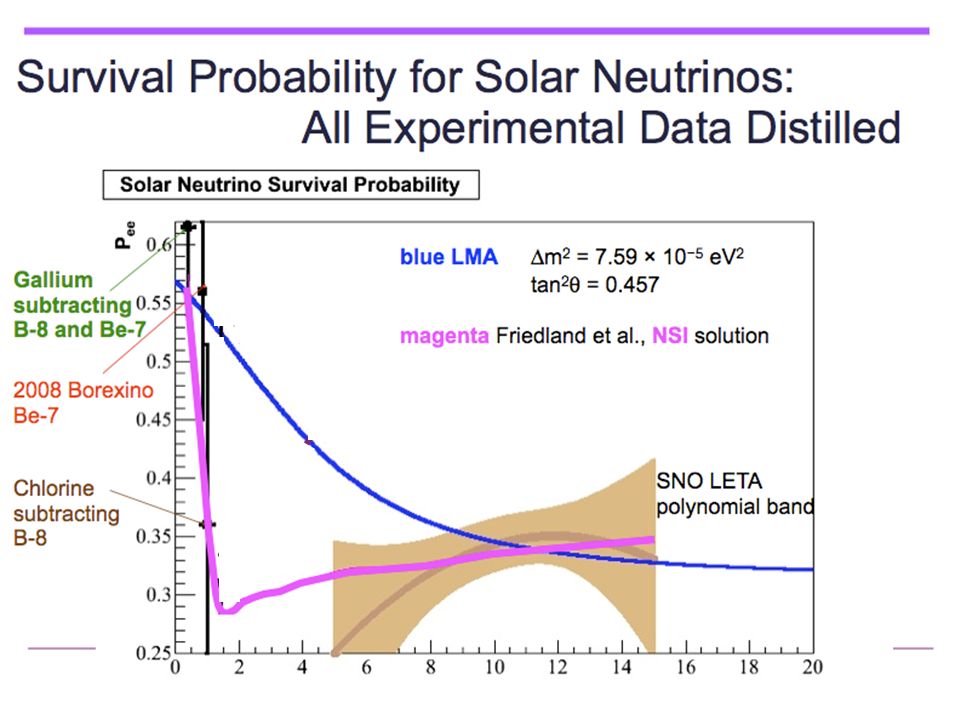
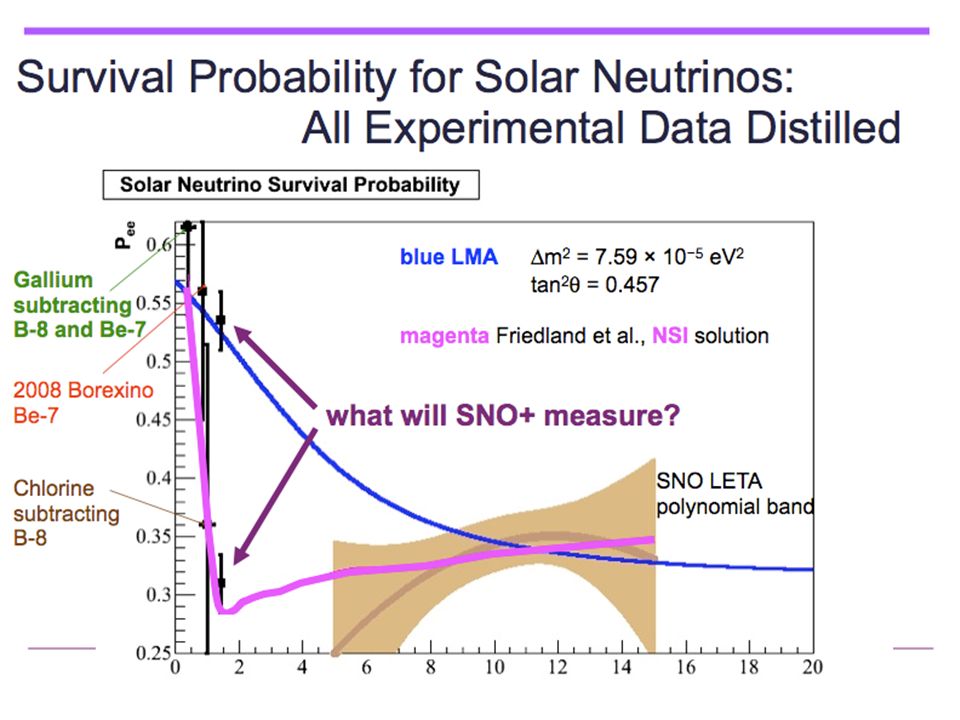
Low Energy Solar Neutrinos

39
p + p 2 H + e + + e p + e − + p 2 H + e 2 H + p 3 He + 3 He + 3 He 4 He + 2 p 3 He + p 4 He + e + + e 3 He + 4 He 7 Be + 7 Be + e − 7 Li + + e 7 Be + p 8 B + 7 Li + p + 8 B 2 + e + + e p-p Solar Fusion Chain CNO Cycle 12 C + p → 13 N + 13 N → 13 C + e + + e 13 C + p → 14 N + 14 N + p → 15 O + 15 O → 15 N + e + + e 15 N + p → 12 C + Solar Neutrinos Detail MSW transition (neutrino-matter couplings), Solar Composition Problem, etc. Detail MSW transition (neutrino-matter couplings), Solar Composition Problem, etc.
, Solar Composition Problem, etc..")
42
210 Bi (U), 40 K are most important for solar studies. Borexino has demonstrated similar levels of backgrounds. pep signal ( 4000 events/yr) CNO Signal After 3 years: ~5% uncertainty After 3 years: ~8% uncertainty 40 K background Can be constrained by peak 210 Bi background Can be inferred from 210 Po peak 3600 pep events/(kton·year), for electron recoils >0.8 MeV SNOLAB depth of 6000 mwe gives a muon flux 800 times less than KamLAND and virtually eliminates background from 11 C, making SNO+ uniquely sensitive for a precision measurement.
 CNO Signal After 3 years: ~5% uncertainty After 3 years: ~8% uncertainty 40 K background Can be constrained by peak 210 Bi background Can be inferred from 210 Po peak 3600 pep events/(kton·year), for electron recoils >0.8 MeV SNOLAB depth of 6000 mwe gives a muon flux 800 times less than KamLAND and virtually eliminates background from 11 C, making SNO+ uniquely sensitive for a precision measurement..")
43
Geo-Neutrinos

44
antineutrino events e + p → e + + n: KamLAND: 33 events per year (1000 tons CH 2 ) / 142 events reactor SNO+: 44 events per year (1000 tons CH 2 ) / 38 events reactor Geo-Neutrino Signal SNO+ geo-neutrinos and reactor backgroundKamLAND geo-neutrino detection…July 28, 2005 in Nature KamLAND
 / 142 events reactor SNO+: 44 events per year (1000 tons CH 2 ) / 38 events reactor Geo-Neutrino Signal SNO+ geo-neutrinos and reactor backgroundKamLAND geo-neutrino detection…July 28, 2005 in Nature KamLAND")
45
Reactor Neutrinos

46
Reactors Contribution to the Spectrum 3,06685Donald C. Cook 4,929657Beaver Valley 1,914648Gentily 2,34617Palisades 2,91589Point Beach 2,531588Davis-Besse 1,509568Kewaunee 3,255559Enrico Fermi 3,1615530Perry 5,07488Nine Mile Point 2,34488James A. Fitzpatrick 1,41455R.E. Ginna 10,572340Darlington 6,192330Pickering 10,32281Bruce Th. Power (GW)d (km)Reactor Main Reactors (distances smaller than 700km to the detector) Bruce reactor will contribute mainly to the central peak. We can take advantage from any “shut-off” period L/E Analysis
d (km)Reactor Main Reactors (distances smaller than 700km to the detector) Bruce reactor will contribute mainly to the central peak. We can take advantage from any shut-off period L/E Analysis.")
47
Nucleon Decay

48
modes where negligible visible energy from by-products is deposited in the detector For example: Violates (B-L) (interesting for matter/antimatter asymmetry) Models can be constructed where this is primary mode {Mohapatra & Perez-Lorenzana, Phys Rev D67, 075015 (2003)} ~6MeV 16 O Order of magnitude improvement on current bound may be possible with just a few months of data !! Order of magnitude improvement on current bound may be possible with just a few months of data !!

49
First Data in 2012 Rough Order or Running: H 2 O ~ couple months Pure Scintillator ~ several months Nd-loaded Scintillator ~ few years Pure Scintillator ~ few years nucleon decay nucleon decay initial solar study initial solar study Phase I Phase I detailed solar study detailed solar study live for supernova running reactor neutrinos geo-neutrinos Phase II ? Other ? Follow-on Phase ~ ?

51
CC Recoil-Electron Spectrum Previous global best-fit LMA point: tan 2 12 = 0.468, m 2 = 7.59x10 -5 eV 2 Flat: 2 = 21.52 / 15 d.o.f. LMA: 2 = 22.56 / 15 d.o.f.

Similar presentations


. This will enable a search for.>")


 Atmospheric Solar –SNO & SK-I Active solar –SK.>")


