Download presentation
Presentation is loading. Please wait.

1
School Sectors Public, Private, & Parochial Public Schools Private Schools Parochial Schools Charter Schools Home-Schooling

2
School Sectors Private & Parochial Schools PK-12 Enrollment In Private Schools 11% of US Students Number Of Private Schools 25+% Of All US Schools 46% To Catholic Schools 36% To Other Religious Schools 18% To Non-Religious Schools Teachers More Satisfied Teachers Claim More Influence Over Practice/Policy Schools Are Smaller And Have Smaller Class Sizes Students More Likely To Receive BA+ By Mid 20’s Students Do Better On Standardized Tests Schools 4x More Likely To Require Community Service Schools Have Higher Grad Requirements NCES Ed Stats

3
School Sectors Why Do Private Schools Do Better? Economic Capital Differences? Human Capital Differences? Social Capital Differences? Cultural Capital Differences? Bureaucracy And Centralization? Are Charter Schools The Public School Answer?

4
Charter school: a school that provides free public elementary and/or secondary education to eligible students under a specific charter granted by the state legislature or other appropriate authority School Sectors Charter Schools

5
Since 1991, 40 states and DC have charter laws Since 1991, 40 states and DC have charter laws –1 st state? Minnesota –Most recent state? Maine (June 2011) –No charter laws: AL, KY, MT, NE, ND, SD, VT, WA, and WV 1999–2008, charter schools increased from 2 to 5% of all public schools1999–2008, charter schools increased from 2 to 5% of all public schools Aud et al. 2011
 –No charter laws: AL, KY, MT, NE, ND, SD, VT, WA, and WV 1999–2008, charter schools increased from 2 to 5% of all public schools1999–2008, charter schools increased from 2 to 5% of all public schools Aud et al")
6
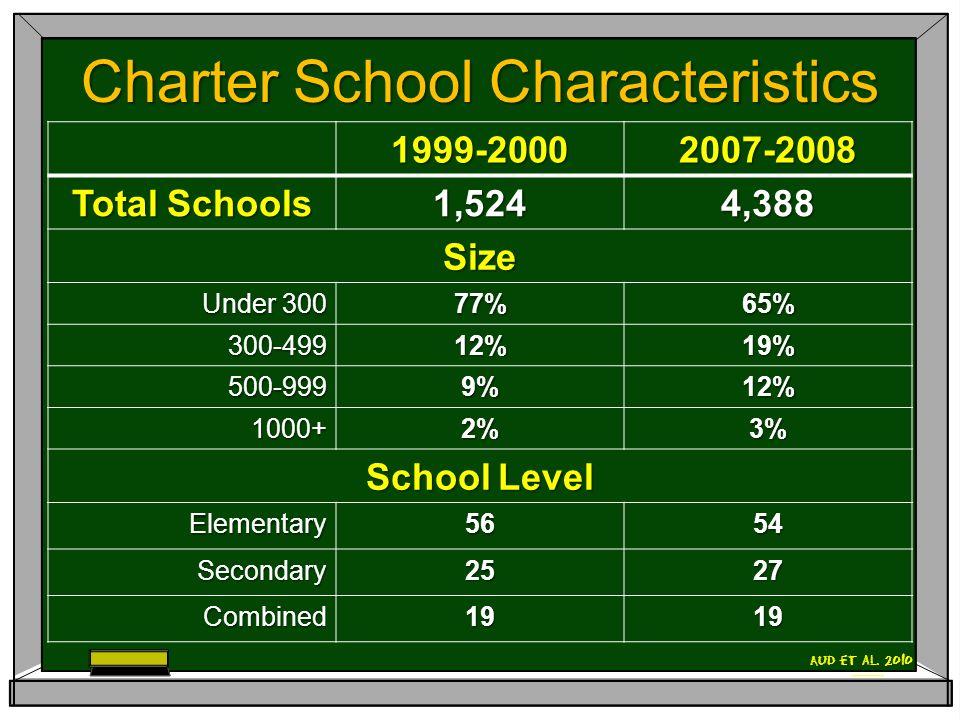
Charter School Characteristics 1999-20002007-2008 Total Schools 1,5244,388 Size Under 300 77%65% 300-49912%19% 500-9999%12% 1000+2%3% School Level Elementary5654 Secondary2527 Combined1919 Aud et al. 2010
7
Charter School and Urbanicity 2007-2008 Aud et al. 2010

8
1999-20002007-2008 Total Schools 1,5244,388 Race Composition More than 50% Black 27%26% More than 50% Hispanic 11%18% More than 50% White 51%43% Free/Reduced Lunch Missing/school did not participate 13%23% 0-25%37%21% 76-100%13%23% Charter School Characteristics Aud et al. 2010

9
Charter School Enrollment 1999-2009 Aud et al. 2010

10
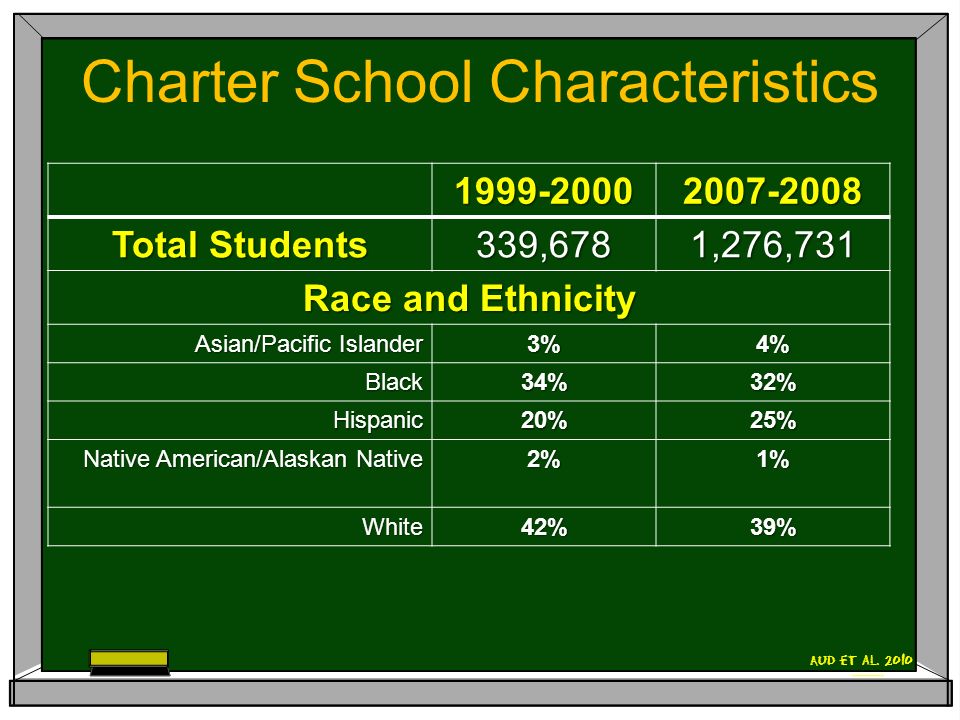
1999-20002007-2008 Total Students 339,6781,276,731 Race and Ethnicity Asian/Pacific Islander 3%4% Black34%32% Hispanic20%25% Native American/Alaskan Native 2%1% White42%39% Charter School Characteristics Aud et al. 2010
11
Charter Schools: Promise or Peril? C OMPETITION –Has not induced large changes in district-wide operations or student achievement in neighboring public schools (Bettinger 2005; Teske et al. 2000) –Some district-operated public schools are adopting charter models E FFICACY AND A CCOUNTABILITY –Achievement results are ambiguous –10-13% of charter schools have closed since 1991
 –Some district-operated public schools are adopting charter models E FFICACY AND A CCOUNTABILITY –Achievement results are ambiguous –10-13% of charter schools have closed since")
12
School Sectors Home Schooling More Than A Million Kids (2%) Parents Are More Educated Parents (25%) Trained As Teachers Main Catalyst For It? Religion Income Higher In Home Schooled Families Almost All Students In Two-Parent Homes Students Watch Less Television

Similar presentations


279-1886>")


 Paid for by tax dollars Usually run by local board.>")

 Augusto Vargas Paul Menard Samsam Metropolitan State University 9-9-2013.>")


