Download presentation
Presentation is loading. Please wait.

1
Balancing on Three Legs: The Tension Between Aligning to Standards, Predicting High-Stakes Outcomes, and Being Sensitive to Growth Julie Alonzo, Joe Nese, Leilani Saez & Gerald Tindal Behavioral Research and Teaching College of Education – UO

2
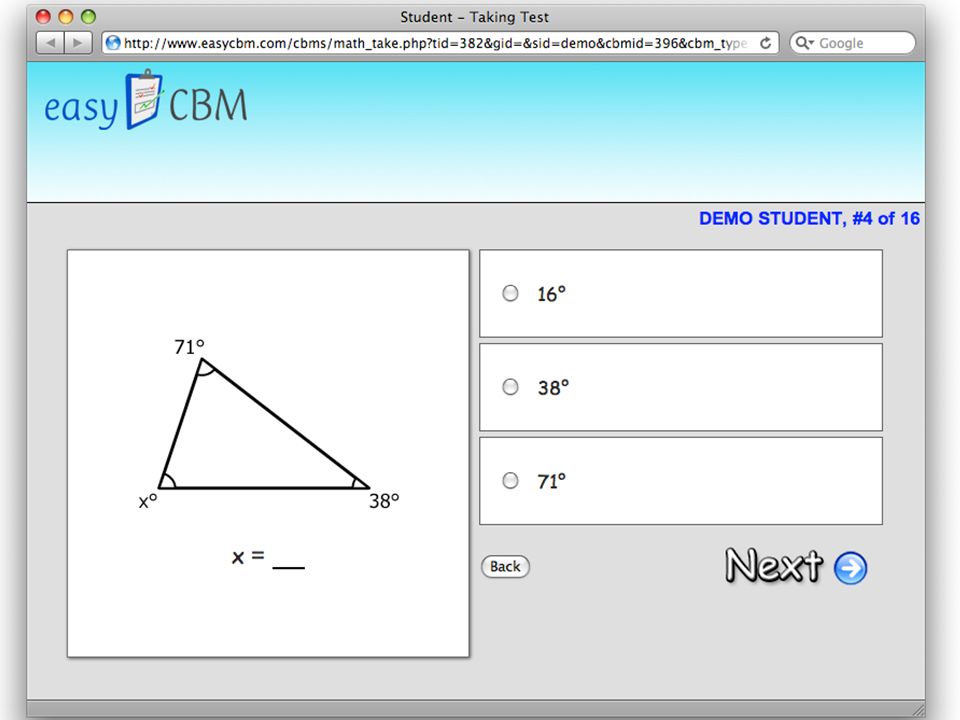
Assessment System easyCBM (2006) – Online benchmarking (45 item) and progress monitoring (16 item) assessment system – K-8 – Mathematics and Reading General outcome measures, based on NCTM Focal Point Standards in Mathematics Philosophically, we see RTI as focusing on improvement of instruction.
 – Online benchmarking (45 item) and progress monitoring (16 item) assessment system – K-8 – Mathematics and Reading General outcome measures, based on NCTM Focal Point Standards in Mathematics Philosophically, we see RTI as focusing on improvement of instruction.")
3
Growth in Test Use Beta Testing District Site First Year Public Use

5
Alignment to Standards National Council of Teachers of Mathematics (NCTM) Three Curriculum Focal Points and Objectives Grade 6 Number & Operations: Developing an understanding of and fluency with multiplication and division of fractions and decimals. Algebra: Writing, interpreting, and using mathematical expressions and equations. Number/Operations/Ratios: Connecting ratio and rate to multiplication and division. Objective 1 Develop and use strategies to estimate the result of decimal and fraction computations & judge the reasonableness of results. (16) Use order of operations to simplify expressions, including exponents and grouping symbols. (22) Determine simple probabilities, both experimental and theoretical. (35) Objective 2 Order, model, and compare fraction and decimals. (15) Construct and analyze tables (e.g., to show quantities that are in equivalent ratios), and they use equations to describe simple relationships (such as 3x = y) shown in a table. (15) Extend whole number multiplication and division to ratios and rates. (49) Objective 3 [Use the commutative, associative, and distributive properties to show that two expressions are equivalent.] (19) Identify and represent equivalent expressions. (18) Solve a wide variety of problems involving ratios and rates. (44) Objective 4 Multiply and divide fractions and decimals to solve problems, including multistep problems and problems involving measurement. (19) Know that the solutions of an equation are the values of the variables that make the equation true. (16) Use simple reasoning about multiplication and division to solve ratio and rate problems. (0) Objective 5 Use common procedures to multiply and divide fractions and decimals efficiently and accurately. (41) Solve simple one-step equations by using number sense, properties of operations and the idea of maintaining equality on both sides of an equation. (19) Expand the repertoire of problems that they can solve by using multiplication and division, and build on understanding of fractions to understand ratios. (0) Objective 6 Use the meanings of fractions, multiplication and division, and the inverse relationship between multiplication and division to make sense of procedures for multiplying and dividing fractions and explain why they work. (18) Understand that variables represent numbers whose exact values are not yet specified, and use variables appropriately. (19) Objective 7 Use the relationship between decimals and fractions, as well as the relationship between finite decimals and whole numbers (i.e., a finite decimal multiplied by an appropriate power of 10 is a whole number), to understand and explain the procedures for multiplying and dividing decimals. (0) Write mathematical expressions and equations that correspond to given situations, evaluate expressions, and use expressions and formulas to solve problems. (19) Objective 8 Understand that expressions in different forms can be equivalent, and rewrite an expression to represent a quantity in a different way. (0) Note. The gray objectives are NCTM Focal Points that did not overlap with any objectives from the Oregon standards, so no items were written to these gray objectives. Those objectives in italics are exclusive to the state of Oregon. Those objectives in brackets are “Connections to Focal Points,” as described by NCTM. Numbers inside the parentheses indicates the total number of items written to that focal point objective.
 Use order of operations to simplify expressions, including exponents and grouping symbols. (22) Determine simple probabilities, both experimental and theoretical. (35) Objective 2 Order, model, and compare fraction and decimals. (15) Construct and analyze tables (e.g., to show quantities that are in equivalent ratios), and they use equations to describe simple relationships (such as 3x = y) shown in a table. (15) Extend whole number multiplication and division to ratios and rates. (49) Objective 3 [Use the commutative, associative, and distributive properties to show that two expressions are equivalent.] (19) Identify and represent equivalent expressions. (18) Solve a wide variety of problems involving ratios and rates. (44) Objective 4 Multiply and divide fractions and decimals to solve problems, including multistep problems and problems involving measurement. (19) Know that the solutions of an equation are the values of the variables that make the equation true. (16) Use simple reasoning about multiplication and division to solve ratio and rate problems. (0) Objective 5 Use common procedures to multiply and divide fractions and decimals efficiently and accurately. (41) Solve simple one-step equations by using number sense, properties of operations and the idea of maintaining equality on both sides of an equation. (19) Expand the repertoire of problems that they can solve by using multiplication and division, and build on understanding of fractions to understand ratios. (0) Objective 6 Use the meanings of fractions, multiplication and division, and the inverse relationship between multiplication and division to make sense of procedures for multiplying and dividing fractions and explain why they work. (18) Understand that variables represent numbers whose exact values are not yet specified, and use variables appropriately. (19) Objective 7 Use the relationship between decimals and fractions, as well as the relationship between finite decimals and whole numbers (i.e., a finite decimal multiplied by an appropriate power of 10 is a whole number), to understand and explain the procedures for multiplying and dividing decimals. (0) Write mathematical expressions and equations that correspond to given situations, evaluate expressions, and use expressions and formulas to solve problems. (19) Objective 8 Understand that expressions in different forms can be equivalent, and rewrite an expression to represent a quantity in a different way. (0) Note. The gray objectives are NCTM Focal Points that did not overlap with any objectives from the Oregon standards, so no items were written to these gray objectives. Those objectives in italics are exclusive to the state of Oregon. Those objectives in brackets are Connections to Focal Points, as described by NCTM. Numbers inside the parentheses indicates the total number of items written to that focal point objective..")
6
Alignment to Standards Categorical Concurrence, Items Aligned with Objectives – Algebra Benchmarks Progress Monitoring % (Frequency) FallWinterSpring Form 1Form 3Form 5Form 7Form 9 RatersI & L Not aligned (0)0(0)0 0 0 0 9(3)13(4)25(8) Vaguely aligned (1)3(1)0(0)3(1)9(3)3(1)19(6)0(0)9(3) Somewhat aligned (2)9(3)6(2)3(1)0(0)3(1)9(3)0(0)3(1) Directly aligned (3)88(28)94(30)94(30)91(29)94(30)63(20)88(28)63(20) Total aligned ratings97(31)100(32)97(31)91(29)97(31)72(23)88(28)66(21) Hit items94(15)100(16)94(15)81(13)94(15)50(8)88(14)56(9) Group total96(46) 74(59) Note. For an item to be considered aligned, both raters had to give the item a rating of 2 or 3; if either rater judged the item to be not aligned (rating of 0 or 1), the item as a whole was deemed unaligned. Categorical Concurrence: the degree to which the assessment covers the content of each standard (Webb, 2002). – In our analysis, the number of items that aligned to the content for each focal point objective, or “hits.”
, the item as a whole was deemed unaligned. Categorical Concurrence: the degree to which the assessment covers the content of each standard (Webb, 2002). – In our analysis, the number of items that aligned to the content for each focal point objective, or hits. .")
7
Alignment to Standards Depth of knowledge (DOK) consistency indicates the DOK required by the standards and assessments. Results of Depth of Knowledge Analysis Form % of item DOK ratings below standard DOK rating % of item DOK ratings at standard DOK rating % of item DOK ratings above standard DOK rating Hit items (of 48) Hits across raters (of 144) % of item DOK rating agreement between raters Frequency of item DOK ratings 12 3 Fall284827469227294914 Winter245421459022354510 Spring205426459026234918 PM_123681042842336444 PM_319622043862234475 PM_526532138761625438 PM_724542342841532439 PM_922601839781828446 Note. PM = progress monitoring. + = 80
 Hits across raters (of 144) % of item DOK rating agreement between raters Frequency of item DOK ratings 12 3 Fall Winter Spring PM_ PM_ PM_ PM_ PM_ Note. PM = progress monitoring. + = 80.")
8
Alignment to Standards Range of Knowledge (ROK): the number of objectives within the focal point for which there is at least one related item. Balance of Representation (BOI): the degree to which one objective is given more emphasis on the assessment than another. Range of Knowledge Correspondence and Balance of Representation Index Forms Number & Operations (6)Algebra (7) Numbers/ Operations/Ratios (3) ROK %BOIROK %BOIROK %BOI Fall83 a 0.6986 d 0.761000.85 Winter1000.811000.721000.90 Spring1000.851000.721000.90 PM_11000.711000.851000.79 PM_383 b 0.7986 e 0.741000.85 PM_51000.7986 f 0.781000.73 PM_783 c 0.751000.801000.90 PM_91000.791000.791000.83 Note. PM = progress monitoring. ROK = Range of knowledge. BI = Balance of representation index. Each superscript represents an objective that was not measured. The numbers inside the parentheses indicates the number of objectives for each focal point. a Objective 3. b Objective 4. c Objective 6. d Objective 2. e Objective 4. f Objective 3.
: the degree to which one objective is given more emphasis on the assessment than another. Range of Knowledge Correspondence and Balance of Representation Index Forms Number & Operations (6)Algebra (7) Numbers/ Operations/Ratios (3) ROK %BOIROK %BOIROK %BOI Fall83 a d Winter Spring PM_ PM_383 b e PM_ f PM_783 c PM_ Note. PM = progress monitoring. ROK = Range of knowledge. BI = Balance of representation index. Each superscript represents an objective that was not measured. The numbers inside the parentheses indicates the number of objectives for each focal point. a Objective 3. b Objective 4. c Objective 6. d Objective 2. e Objective 4. f Objective 3..")
9
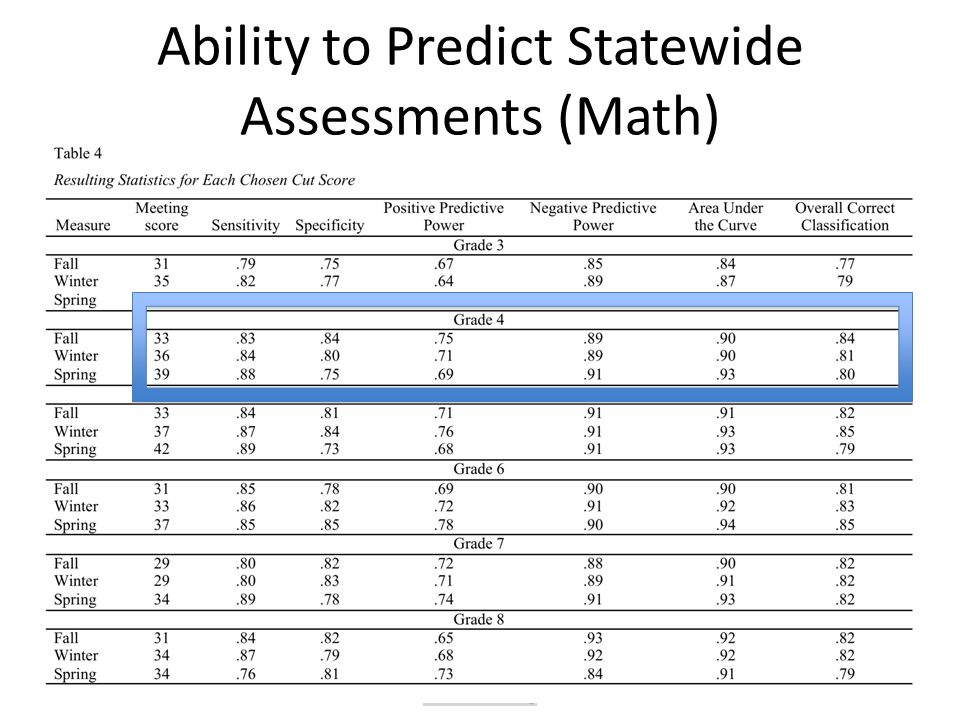
Ability to Predict Statewide Assessments (Math) Oregon (grade 4 fall BM)Washington (grade 4 fall BM)
 Oregon (grade 4 fall BM)Washington (grade 4 fall BM)")
10
Ability to Predict Statewide Assessments (Math)
")
12
Test forms are designed to target middle of year difficulty, with a # of items intentionally ‘easy’ to ensure access to the scale for students with low math ability. Grade 4 Fall easyCBM Norms 25 th percentile = 40 th percentile = 50 th percentile = n =

13
Grade 4 Winter easyCBM Norms 25 th percentile = 40 th percentile = 50 th percentile = n =

14
By the spring, higher-performing students have reached a ceiling. Grade 4 Fall easyCBM Norms 25 th percentile = 40 th percentile = 50 th percentile = n =

15
Ability to Predict TerraNova Math, Grade 1 a Cut score if following criteria proposed by Silberglitt and Hintze (2005). b Cut score if the selection criteria was to sensitivity >.90. c Highest sum, sensitivity and specificity.

16
Sensitivity to Measuring Growth for Low-Performing Students

17
1 standard deviation Mean of students’ estimated ability 1 standard deviation Mean of estimated Item difficulty 90 th percentile 10 th percentile 90 th percentile

18
Sensitivity to Measuring Growth for Low-Performing Students (5 th grade) All Students Low Performers through the 15 th Percentile
 All Students Low Performers through the 15 th Percentile")
19
Key Take-Aways As student performance on CBMs becomes increasingly high-stakes, our attention to technical adequacy needs to increase commensurately Too great a focus on any one of the legs (alignment, ability to predict state test performance, sensitivity to measuring growth for low-performing students) puts the whole at risk.
 puts the whole at risk.")
20
For More Information http://www.brtprojects.org http://easyCBM.com

Similar presentations


 Conceptually>")


 Alignment Study December 5, 2006.>")
>")