Download presentation
Presentation is loading. Please wait.

2
Isaac Newton showed that a glass prism could be used to split sunlight into a spectrum in 1666. Further studies by William Wollaston in 1802 revealed some black lines on the component colours of the solar spectrum. More detailed observations by Joseph von Fraunhofer resulted in 574 of these lines being mapped by 1815. These lines were named "Fraunhofer lines" in his honour.

4
The collection of measurements signals of the matter as a function of electromagnetic radiation is called a spectrum. The study of the interaction of electromagnetic radiation with matter as a function of wavelength (λ) or frequency (ν). Spectrum Spectrum In spectroscopy the emitted or absorbed radiation is measured by means of an instrument called a spectrometer. Spectrometer Spectrometer
 or frequency (ν). Spectrum Spectrum In spectroscopy the emitted or absorbed radiation is measured by means of an instrument called a spectrometer. Spectrometer Spectrometer.")
5
The type of spectroscopy depends on the physical quantity measured. Normally, the quantity that is measured is an intensity, either of energy absorbed or produced. When matter is energized (excited) by the application of thermal, electrical, nuclear or radiant energy, electromagnetic radiation is often emitted as the matter relaxes back to its original (ground) state. The spectrum of radiation emitted by a substance that has absorbed energy is called an emission spectrum and the science is appropriately called emission spectroscopy. Emission spectroscopy Another approach often used to study the interaction of electromagnetic radiation with matter is one where by a continuous range of radiation is allowed to fall on a substance; then the frequencies absorbed by the substance are examined. The resulting spectrum from the substance contains the original range of radiation with dark spaces that correspond to missing, or absorbed, frequencies. This type of spectrpscopy is called an absorption spectrpscopy. Absorption spectrpscopy Each chemical element of the periodic chart has a unique and therefore, characteristic line spectrum.
 by the application of thermal, electrical, nuclear or radiant energy, electromagnetic radiation is often emitted as the matter relaxes back to its original (ground) state. The spectrum of radiation emitted by a substance that has absorbed energy is called an emission spectrum and the science is appropriately called emission spectroscopy. Emission spectroscopy Another approach often used to study the interaction of electromagnetic radiation with matter is one where by a continuous range of radiation is allowed to fall on a substance; then the frequencies absorbed by the substance are examined. The resulting spectrum from the substance contains the original range of radiation with dark spaces that correspond to missing, or absorbed, frequencies. This type of spectrpscopy is called an absorption spectrpscopy. Absorption spectrpscopy Each chemical element of the periodic chart has a unique and therefore, characteristic line spectrum..")
6
The cathode is heated to drive electrons off into the tube. Electrons gain kinetic energy as they arepulled toward the anode. The electron hits a hydrogen(H) atom. The electron will use its kinetic energy to excite the H atom.
 atom. The electron will use its kinetic energy to excite the H atom..")
7
There are in general three types of spectra: continuous, line and band. The sun and heated solids produce continuous spectra in which the emitted radiation contains all frequencies. Line spectra are produced by excited atoms in the gas phase and contain only certain frequencies, all other frequencies being absent. Band spectra are produced by excited molecules emitting radiation in groups of closely spaced lines that merge to form bands.

8
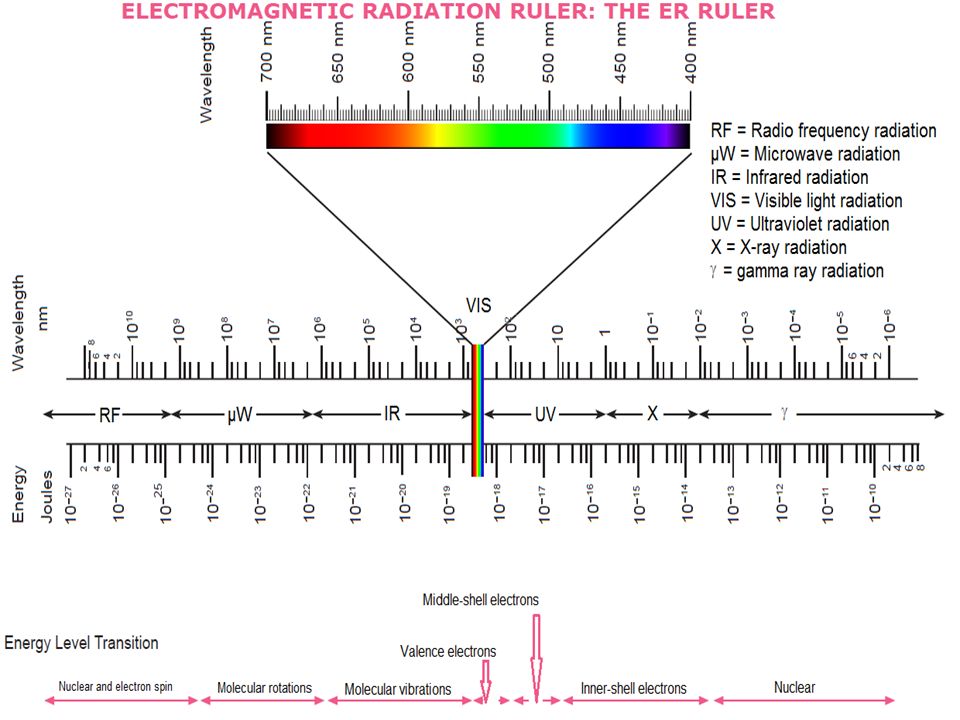
Spectroscopic techniques all work on the principle of that, under certain conditions, materials absorb or emit energy. Atoms are spherically symmetric but molecules have shapes which permit them to vibrate and rotate. These vibrations and rotations provide new energy Levels which are also quantized.

10
Absorbing a photon increases the energy of a system. Emitting a photon decreases the energy of a system.

11
Absorbing an infrared photon can increase the vibrational energy of a molecule. A vibrating molecule can emit an infrared photon and decrease its rate of vibration.

12
Absorbing a microwave photon can increase the rotational energy of a molecule. A rotating molecule can emit a microwave photon and decrease its rate of rotation.

13
Absorbing a photon can increase the translational energy of a molecule. A moving molecule Can emit a photon and slow up.

14
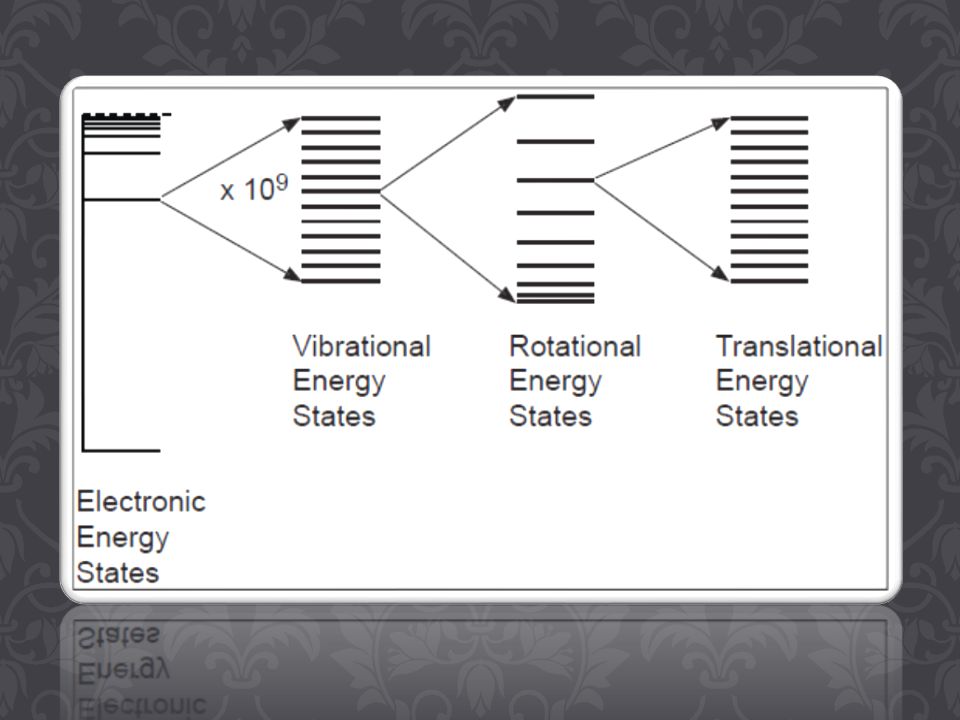
As we know, electrons can occupy different electronic energy states. In molecules the electronic states are subdivided into vibrational states. The electronic-vibrational states are also subdivided into rotational states.

16
Transitions between electronic levels give line spectra. Transitions between electronic, vibrational states give more complex spectra. Transitions between electronic, vibrational, rotational states give rise to spectra that appear to have bands.

17
In the examples at right, the continuous spectrum (a) is reduced by the absorption pattern (b) to give the resulting spectrum (c).
 is reduced by the absorption pattern (b) to give the resulting spectrum (c).")
18
1. UV-vis spectroscopy 2. Vibrational Spectroscopy (IR and Raman) 3. Nuclear Magnetic Resonance (NMR) 4. Electron Spin Resonance (ESR) 5. X-ray spectroscopy 6. Electron spectroscopy 7. Mass spectroscopy 8. Mössbauer spectroscopy 9. Thermal analysis 10. … There are as many different types of spectroscopy as there are energy sources! Here are some examples:
 4. Electron Spin Resonance (ESR) 5. X-ray spectroscopy 6. Electron spectroscopy 7. Mass spectroscopy 8. Mössbauer spectroscopy 9. Thermal analysis 10. … There are as many different types of spectroscopy as there are energy sources. Here are some examples:.")
19
All atoms absorb in the Ultraviolet (UV) region because these photons are energetic enough to excite outer electrons. If the frequency is high enough, photoionization takes place. The visible region of the spectrum comprises photon energies of 1.77 to 3.1 eV, and the near ultraviolet region, out to 200 nm, extends this energy range to 6.2 eV. Ultraviolet radiation having wavelengths less than 200 nm is difficult to handle, and is seldom used as a routine tool for structural analysis. Visible absorption spectroscopy is often combined with UV absorption spectroscopy in UV/Vis spectroscopy.

20
A diagram showing the various kinds of electronic excitation that may occur in organic molecules is shown on the right. Only the two lowest energy ones are achieved by the energies available in the 200 to 800 nm spectrum. As a rule, energetically favored electron promotion will be from the highest occupied molecular orbital (HOMO) to the lowest unoccupied molecular orbital (LUMO), and the resulting species is called an excited state.
 to the lowest unoccupied molecular orbital (LUMO), and the resulting species is called an excited state..")
21
When sample molecules are exposed to light having an energy that matches a possible electronic transition within the molecule, some of the light energy will be absorbed as the electron is promoted to a higher energy orbital. An optical spectrometer records the wavelengths at which absorption occurs, together with the degree of absorption at each wavelength. The resulting spectrum is presented as a graph of absorbance (A) versus wavelength. Absorbance usually ranges from 0 (no absorption) to 2 (99% absorption), and is precisely defined in context with spectrometer operation. Because the absorbance of a sample will be proportional to the number of absorbing molecules in the spectrometer light beam (e.g. their molar concentration in the sample tube), it is necessary to correct the absorbance value for this and other operational factors if the spectra of different compounds are to be compared in a meaningful way. The corrected absorption value is called "molar absorptivity", and is particularly useful when comparing the spectra of different compounds and determining the relative strength of light absorbing functions (chromophores). Molar absorptivity (ε) is defined as: Molar Absorptivity ε = A/cl (A= absorbance, c = sample concentration in moles/liter & l = length of light path through the sample in cm.)
 versus wavelength. Absorbance usually ranges from 0 (no absorption) to 2 (99% absorption), and is precisely defined in context with spectrometer operation. Because the absorbance of a sample will be proportional to the number of absorbing molecules in the spectrometer light beam (e.g. their molar concentration in the sample tube), it is necessary to correct the absorbance value for this and other operational factors if the spectra of different compounds are to be compared in a meaningful way. The corrected absorption value is called molar absorptivity , and is particularly useful when comparing the spectra of different compounds and determining the relative strength of light absorbing functions (chromophores). Molar absorptivity (ε) is defined as: Molar Absorptivity ε = A/cl (A= absorbance, c = sample concentration in moles/liter & l = length of light path through the sample in cm.).")
22
ε : extinction coefficient I 0 : incident radiation c : concentration A = ε cl log(I 0 /I) = ε cl I: transmitted radiation l : path length A : absorbance
 = ε cl I: transmitted radiation l : path length A : absorbance")
23
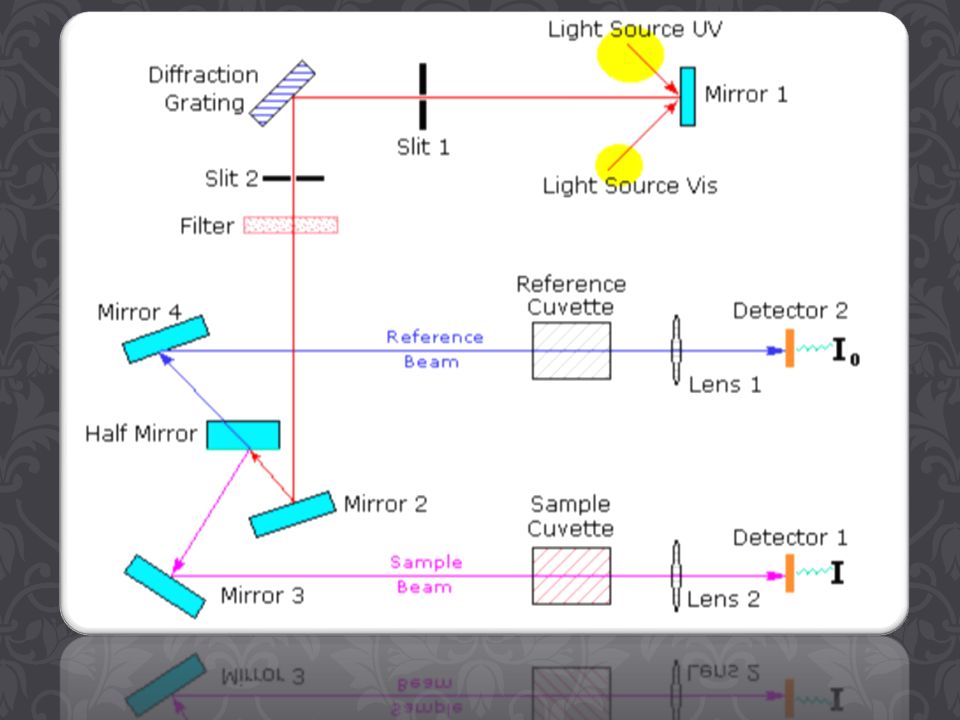
A diagram of the components of a typical spectrometer are shown in the following diagram. The functioning of this instrument is relatively straightforward. A beam of light from a visible and/or UV light source (colored red) is separated into its component wavelengths by a prism or diffraction grating. Each monochromatic (single wavelength) beam in turn is split into two equal intensity beams by a half- mirrored device. One beam, the sample beam, passes through a small transparent container (cuvette) containing a solution of the compound being studied in a transparent solvent. The other beam, the reference (colored blue), passes through an identical cuvette containing only the solvent. The intensities of these light beams are then measured by electronic detectors and compared. The intensity of the reference beam, which should have suffered little or no light absorption, is defined as I 0. The intensity of the sample beam is defined as I. Over a short period of time, the spectrometer automatically scans all the component wavelengths in the manner described. The ultraviolet (UV) region scanned is normally from 200 to 400 nm, and the visible portion is from 400 to 800 nm.
 is separated into its component wavelengths by a prism or diffraction grating. Each monochromatic (single wavelength) beam in turn is split into two equal intensity beams by a half- mirrored device. One beam, the sample beam, passes through a small transparent container (cuvette) containing a solution of the compound being studied in a transparent solvent. The other beam, the reference (colored blue), passes through an identical cuvette containing only the solvent. The intensities of these light beams are then measured by electronic detectors and compared. The intensity of the reference beam, which should have suffered little or no light absorption, is defined as I 0. The intensity of the sample beam is defined as I. Over a short period of time, the spectrometer automatically scans all the component wavelengths in the manner described. The ultraviolet (UV) region scanned is normally from 200 to 400 nm, and the visible portion is from 400 to 800 nm..")
25
If the sample compound absorbs light then I is less than I 0, and this difference may be plotted on a graph versus wavelength, as shown on the right. Absorption may be presented as transmittance (T = I/I 0 ) or absorbance (A= log I 0 /I). If no absorption has occurred, T = 1.0 and A= 0. Most spectrometers display absorbance on the vertical axis, and the commonly observed range is from 0 (100% transmittance) to 2 (1% transmittance). Different compounds may have very different absorption maxima and absorbance. Intensely absorbing compounds must be examined in dilute solution, so that significant light energy is received by the detector, and this requires the use of completely transparent solvents. The most commonly used solvents are water, ethanol, hexane and cyclohexane.
 or absorbance (A= log I 0 /I). If no absorption has occurred, T = 1.0 and A= 0. Most spectrometers display absorbance on the vertical axis, and the commonly observed range is from 0 (100% transmittance) to 2 (1% transmittance). Different compounds may have very different absorption maxima and absorbance. Intensely absorbing compounds must be examined in dilute solution, so that significant light energy is received by the detector, and this requires the use of completely transparent solvents. The most commonly used solvents are water, ethanol, hexane and cyclohexane..")
26
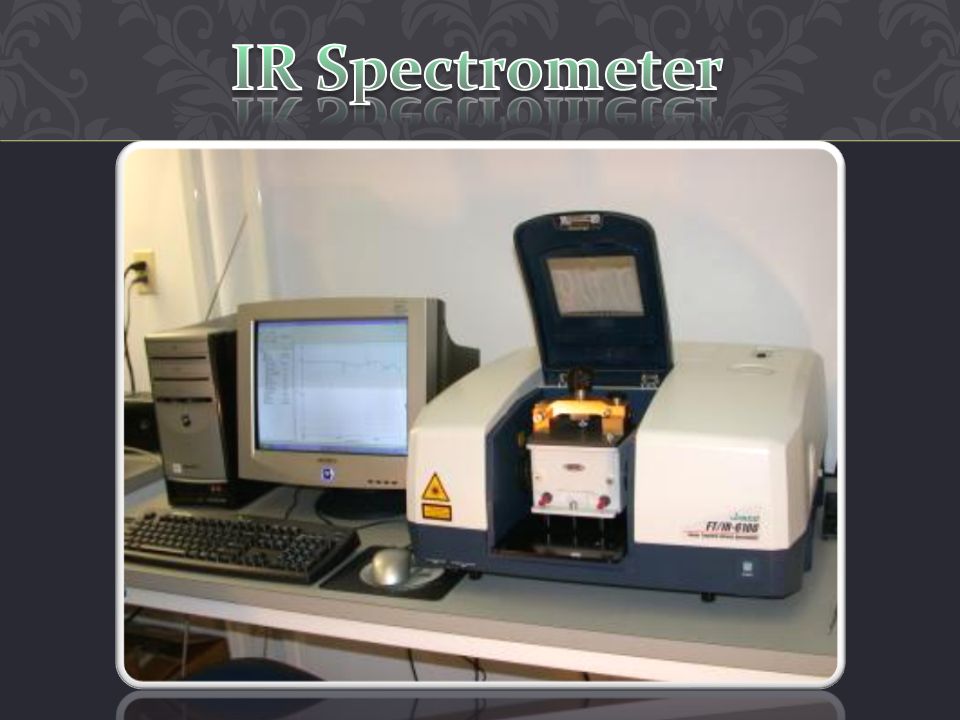
Infrared spectroscopy offers the possibility to measure different types of inter atomic bond vibrations at different frequencies. Especially in organic chemistry the analysis of IR absorption spectra shows what type of bonds are present in the sample. It is also an important method for analyzing polymers and constituents like fillers, pigments and plasticizers.

27
Hooke’s Law: ν = (1/2π) √(k/μ) μ = m 1 m 2 /(m 1 + m 2 ) μ: reduced mass ν: vibrational frequency m: atomic mass k: force constant Atoms in solids vibrate at frequencies of 1012 to 1014 Hz StretchingBending
 √(k/μ) μ = m 1 m 2 /(m 1 + m 2 ) μ: reduced mass ν: vibrational frequency m: atomic mass k: force constant Atoms in solids vibrate at frequencies of 1012 to 1014 Hz StretchingBending")
28
Linear molecule: 3N-5 normal modes of vibration Non-linear molecule: 3N-6 normal modes of vibration

29
Frequency of the incident radiation is varied and the quantity of radiation absorbed or transmitted by the sample is obtained.

31
Identification Structural information Estimation of sample purity Calculation of force constant Monitor the progress of reaction Study of hydrogen bonding

Similar presentations


 is broken up into its component frequencies.>")


