Download presentation
Presentation is loading. Please wait.

1
Climate Threat to the Planet:* Implications for Energy Policy and Intergenerational Justice Jim Hansen December 17, 2008 Bjerknes Lecture, American Geophysical Union San Francisco, California *Any Policy-Related Statements are Personal Opinion

2
Global Warming as a Moral Issue L.D. Danny Harvey Department of Geography University of Toronto harvey@geog.utoronto.ca

3
GISS analysis of global surface temperature; 2008 point is 11-month mean.

4
Surface temperature anomaly relative to base period 1951-1980. Left: Anomaly for 2008 meteorological year (December-November). Right: Anomaly for first seven years of this century.
. Right: Anomaly for first seven years of this century..")
5
Basis of Understanding 1. Earth’s Paleoclimate History 2. On-Going Global Changes 3. Climate Models (note: modeling #3, but aids other two)
.")
6
Climate Change Depends on (global, averaged over chaos) 1. Equilibrium Climate Sensitivity 2. Forcings: Human & Natural 3. Response Time (Ocean Inertia)
.")
7
CO 2, CH 4 and temperature records from Antarctic ice core data Source: Vimeux, F., K.M. Cuffey, and Jouzel, J., 2002, "New insights into Southern Hemisphere temperature changes from Vostok ice cores using deuterium excess correction", Earth and Planetary Science Letters, 203, 829-843.

8
(a) CO 2, CH 4 and sea level for past 800 ky. (b) Climate forcings due to changes of GHGs and ice sheet area, (c) Calculated global temperature change based on above forcings and climate sensitivity ¾°C per W/m 2. Observations are Antarctic T change divided by two.
 Climate forcings due to changes of GHGs and ice sheet area, (c) Calculated global temperature change based on above forcings and climate sensitivity ¾°C per W/m 2. Observations are Antarctic T change divided by two..")
9
Empirical Climate Sensitivity 3 ± 0.5C for 2 X CO 2 1. I ncludes all fast-feedbacks* * water vapor, clouds, aerosols, surface albedo (Note: aerosol feedback included) 2. Paleo yields precise result 3. Relevant to today’s climate sensitivity generally depends on climate state
 2. Paleo yields precise result 3. Relevant to today’s climate sensitivity generally depends on climate state.")
10
Climate Threat to the Planet The Venus Syndrome

12
Runaway Greenhouse Effect? 1. Unprecedented Speed of +Forcing 2. Negative Feedbacks (e.g. Increased Weathering Rate) of Little Help 3. Solar Irradiance has Increased My Opinion: All Coal ?? (Runaway Possible) Coal + Tars !! (Dead Certainty)
 of Little Help 3. Solar Irradiance has Increased My Opinion: All Coal . (Runaway Possible) Coal + Tars !. (Dead Certainty).")
14
Metrics for “Dangerous” Change Extermination of Animal & Plant Species 1. Extinction of Polar and Alpine Species 2. Unsustainable Migration Rates Ice Sheet Disintegration: Global Sea Level 1. Long-Term Change from Paleoclimate Data 2. Ice Sheet Response Time Regional Climate Disruptions 1. Increase of Extreme Events 2. Shifting Zones/Freshwater Shortages

15
Tipping Point Definitions 1. Tipping Level - Climate forcing (greenhouse gas amount) reaches a point such that no additional forcing is required for large climate change and impacts 2. Point of No Return - Climate system reaches a point with unstoppable irreversible climate impacts (irreversible on a practical time scale) Example: disintegration of large ice sheet
 reaches a point such that no additional forcing is required for large climate change and impacts 2. Point of No Return - Climate system reaches a point with unstoppable irreversible climate impacts (irreversible on a practical time scale) Example: disintegration of large ice sheet.")
16
Sea level rise – 20 cm since 1880 Source: IPCC 2007, AR4, WG1

17
Source: NSIDC, http://nsidc.org/news Sea ice extent, Sept 2005 (white) and average extent during the 1980s (pink line)
 and average extent during the 1980s (pink line)")
18
Source: National Snow and Ice Data Center (NSIDC), USA, http://nsidc.org/news Sea ice extent, Sept 2007
, USA, Sea ice extent, Sept 2007")
19
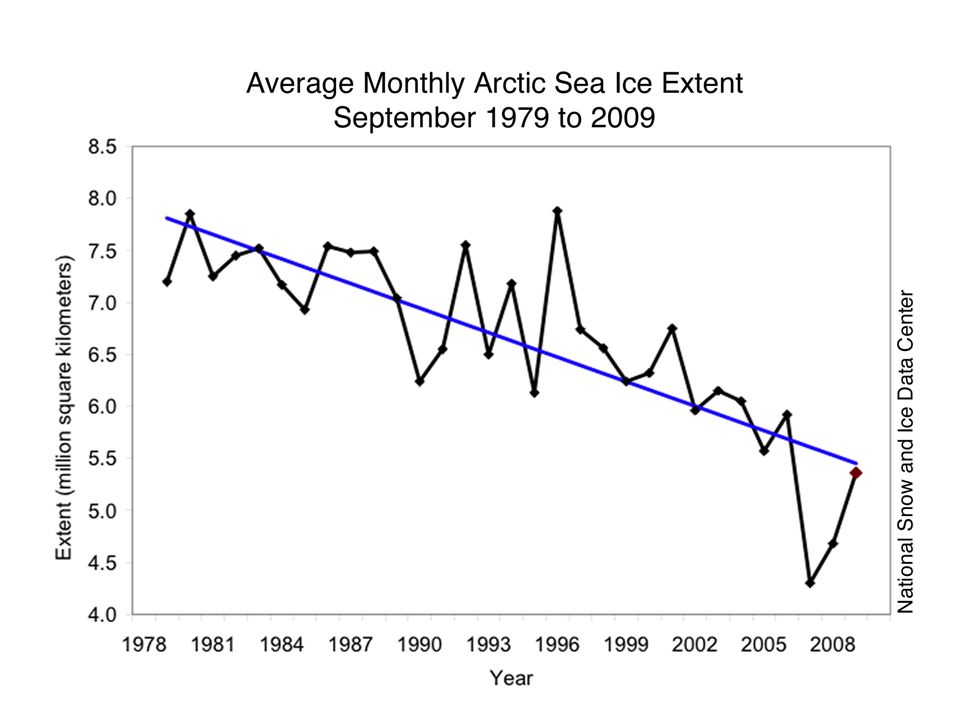
Source: NSIDC, http://nsidc.org/news Sea ice extent, Sept 2009

21
Melt descending into a moulin, a vertical shaft carrying water to ice sheet base. Source: Roger Braithwaite, University of Manchester (UK) Surface Melt on Greenland
 Surface Melt on Greenland.")
22
Jakobshavn Ice Stream in Greenland Discharge from major Greenland ice streams is accelerating markedly. Source: Prof. Konrad Steffen, Univ. of Colorado

23
Rongbuk Glacier Rongbuk glacier in 1968 (top) and 2007. The largest glacier on Mount Everest’s northern slopes feeds Rongbuk River.

24
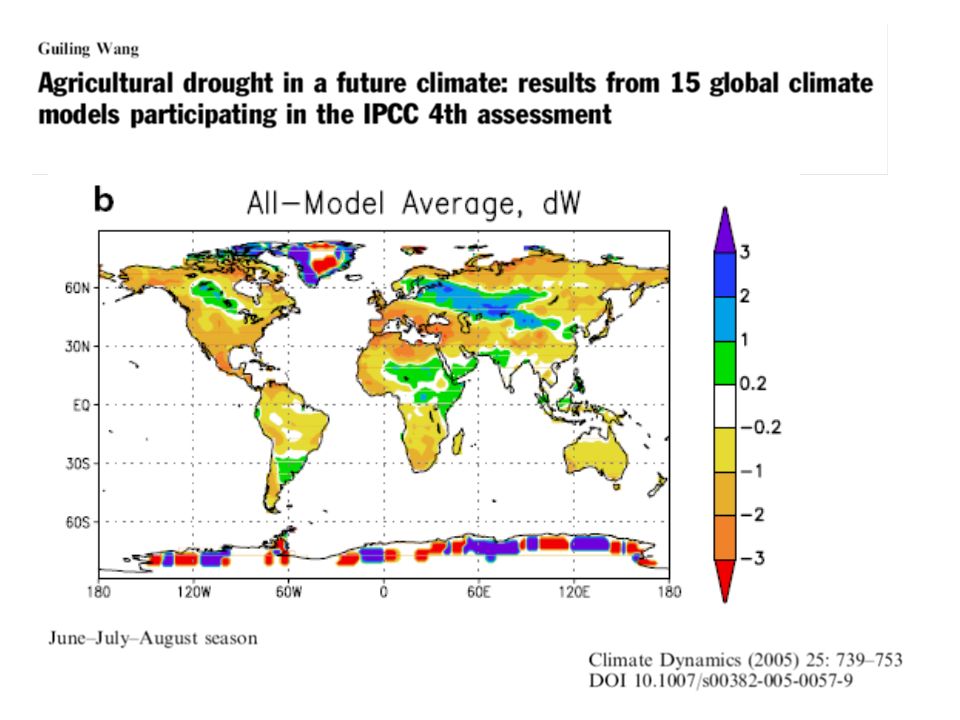
Areas of the world dependent on winter snowfall for summer moisture: Shown is the ratio of annual snowfall to annual runoff. The red line outlines the areas where runoff is predominantly from snowmelt and there is not adequate storage to buffer seasonal variations. Source: Barnett et al (2005)
.")
25
Subtropics expected to expand with global warming. Observations show 4 degrees of latitude expansion. Pier on Lake Mead

27
Fires Are Increasing World-Wide Source: Westerling et al. 2006 Western US area burned Wildfires in Western US have increased 4-fold in 30 years.

28
Coral Reef off Fiji (Photo: Kevin Roland) Stresses on Coral Reefs
 Stresses on Coral Reefs")
29
Source: Nature 442, 978-980 (2006)
")
30
Assessment of Target CO 2 Phenomenon Target CO 2 (ppm) 1. Arctic Sea Ice300-325 2. Ice Sheets/Sea Level300-350 3. Shifting Climatic Zones300-350 4. Alpine Water Supplies300-350 5. Avoid Ocean Acidification300-350 Initial Target CO 2 = 350* ppm *assumes CH 4, O 3, Black Soot decrease

31
Target CO 2 : < 350 ppm To preserve creation, the planet on which civilization developed

32
Initial Target CO 2 : 350 ppm Technically Feasible (but not if business-as-usual continues) Quick Coal Phase-Out Critical (long lifetime of atmospheric CO 2 ) (must halt construction of any new coal plants that do not capture & store CO 2 )
 Quick Coal Phase-Out Critical (long lifetime of atmospheric CO 2 ) (must halt construction of any new coal plants that do not capture & store CO 2 )")
33
Damage-control Scenarios

34
Figure 1.5 Business as usual Change in Global Mean Temperature in the context of observed or inferred past variations

35
The Challenge We can avoid destroying creation! (+cleaner planet, + good jobs!) We have to figure out how to live without fossil fuels someday… Why not now?
 We have to figure out how to live without fossil fuels someday… Why not now .")
36
Carbon Tax & 100% Dividend 1. Tax Large & Growing (but get it in place!) - tap efficiency potential & life style choices 2. Entire Tax Returned - equal monthly deposits in bank accounts 3. Limited Government Role - keep hands off money! - eliminate fossil subsidies - let marketplace choose winners - change profit motivation of utilities - watch U.S. modernize & emissions fall!
 - tap efficiency potential & life style choices 2. Entire Tax Returned - equal monthly deposits in bank accounts 3. Limited Government Role - keep hands off money. - eliminate fossil subsidies - let marketplace choose winners - change profit motivation of utilities - watch U.S. modernize & emissions fall!.")
37
Intergenerational Conflict Intergenerational inequity and injustice is the result, affecting the young and unborn. ‘Did not know’ defense of prior generations no longer viable. Ethical and legal liability questions raised by actions that deceived the public. Continued failure of political process (not even available to young and unborn) may cause increasing public protests.
 may cause increasing public protests..")
38
Major Impacts of Concern Sea level rise of 6-12 m over several centuries to a 1000 years or more Increased occurrence of drought Increased water stress in vulnerable regions Species extinction (1/3 to ½ this century) Acidification of the oceans
 Acidification of the oceans")
39
Moral and Ethical Dimensions The sanctity of life Disproportionate impacts on the most vulnerable (poor people) and on developing countries – those least responsible, and least able to adapt Intergenerational impacts, discounting Imposition of involuntary risk on others
 and on developing countries – those least responsible, and least able to adapt Intergenerational impacts, discounting Imposition of involuntary risk on others")
40
What Will it Take? Stabilization of the human population at the lowest possible level (i.e., 8 billion instead of 10 billion or more) An end to the growth-for-the-sake-of-growth paradigm Massive emphasis on energy efficiency and conservation (an efficiency and sufficiency ethic) Massive acceleration in the deployment of renewable energy sources
 An end to the growth-for-the-sake-of-growth paradigm Massive emphasis on energy efficiency and conservation (an efficiency and sufficiency ethic) Massive acceleration in the deployment of renewable energy sources.")
41
Personal Decisions with Moral Implications Use of energy (especially concerning transportation, home heating and cooling, energy-intensive conveniences) Levels of consumption (how much “stuff” are you buying?) The amount of meat in your diet The levels of convenience and comfort that you demand
 Levels of consumption (how much stuff are you buying ) The amount of meat in your diet The levels of convenience and comfort that you demand")
42
Moral Behaviour is To be happy with less To consume less To tread as lightly as possible on the planet To make “sacrifices” cheerfully (Ghandi)
")
Similar presentations

 - What is Known (public/policymakers) 2. Planetary Emergency - Climate Inertia.>")


 - What is Known (public/policymakers) 2. Planetary Emergency - Climate Inertia.>")
 - What is Known (public/policymakers) 2. The Climate Crisis - Positive Feedbacks.>")


 1. Enhanced Greenhouse Effect 2. CO 2 sensitivity 3. Projected CO 2 emissions 4. Projected CO 2 atmosphere concentrations 5. What.>")


