Download presentation
Presentation is loading. Please wait.

1
CREATIVE CLASS and ECONOMIC GROWTH Barbara Polachová Olga Staňková Olga Georgievová Economic Issues in North America May 7, 2012

2
STRUCTURE Theoretical framework Regression analysis Case studies: Colorado and Louisiana

3
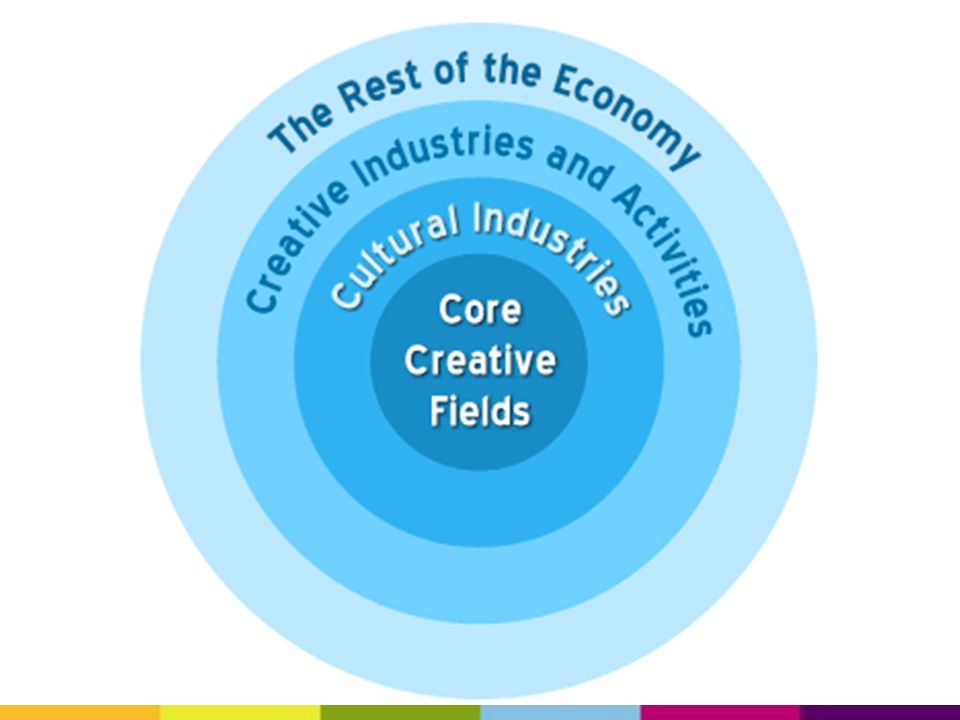
THEORETICAL FRAMEWORK -Creative economy -Why is culture an economic force? -Theory of Creative Class (R.Florida) - TALENT, TECHNOLOGY, TOLERANCE -Creativity Index
 - TALENT, TECHNOLOGY, TOLERANCE -Creativity Index.")
4
Creative Economy

5
Venture capital Creative Factory Creative environment

7
CREATIVITY INDEX the Creative class share of the workforce Innovation – new patents per capita the High-Tech Index the Gay Index = baseline indicator of a region's overall standing in the creative economy

8
REGRESSION ANALYSIS GOAL OF THE ANALYSIS: to see if there is a correlation between the size of creative class and economic growth SIZE OF CREATIVE CLASS REAL GSP PER CAPITA ?

9
REGRESSION ANALYSIS DATA USED: – Gross State Product /from US Census/ = a measurement of the economic output of a state; the sum of all value added by industries within the state; in real (2000) dollars – Popluation by state /from US Census/ – Size of a creative class /from Economic Research Service of US Department of Agriculture/
 dollars – Popluation by state /from US Census/ – Size of a creative class /from Economic Research Service of US Department of Agriculture/")
10
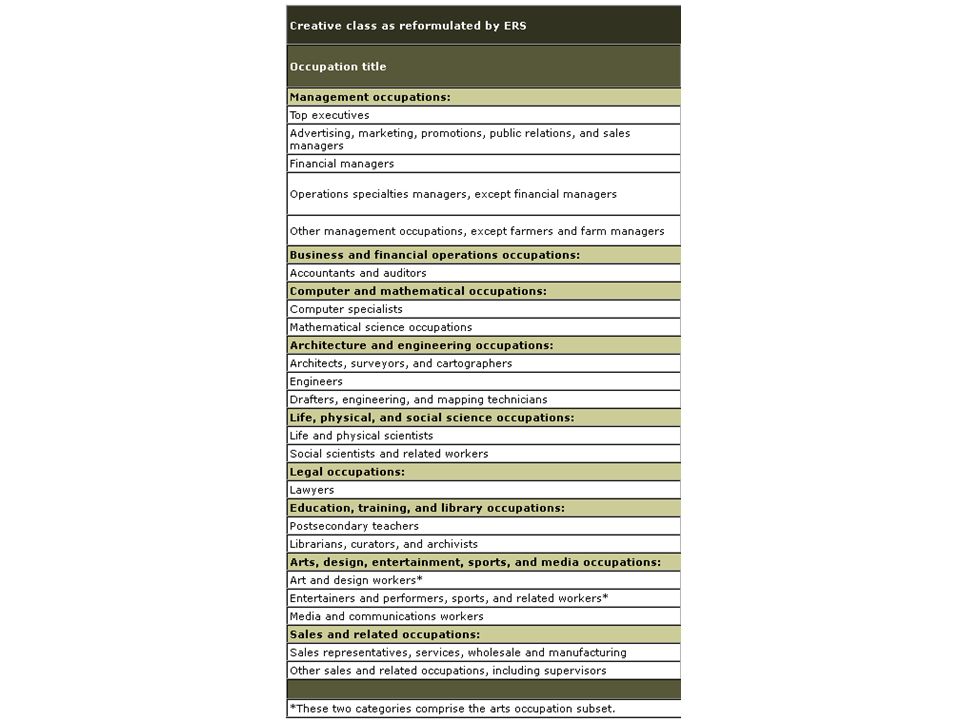
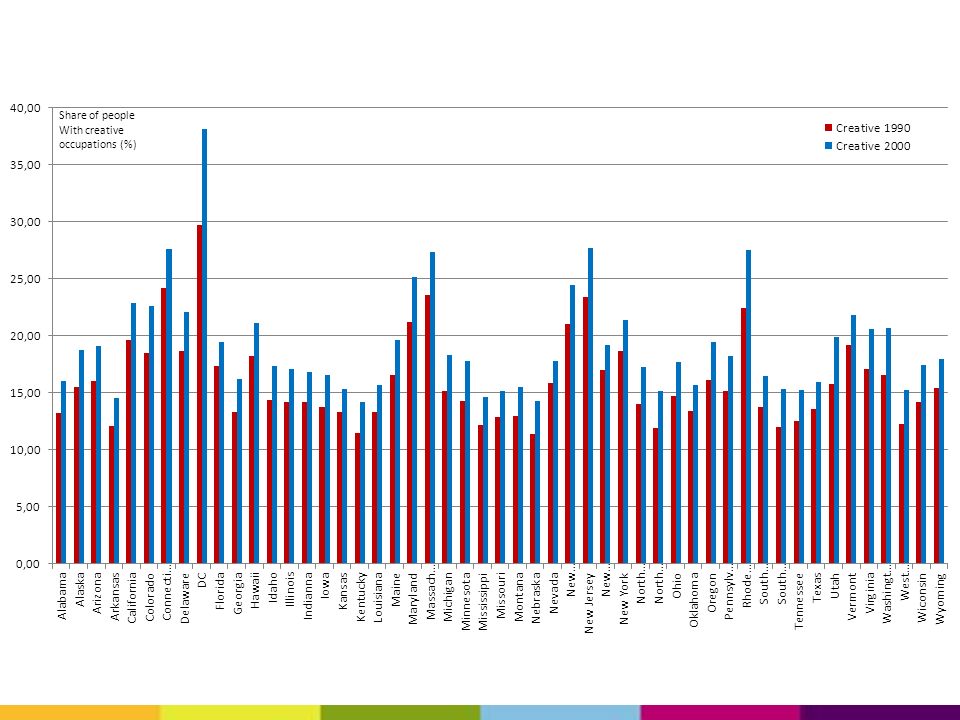
REGRESSION ANALYSIS DATA USED: – Size of Creative Class /by ERS of USDA/ IDENTIFYING CREATIVE OCCUPATIONS: – a Bureau of Labor Statistics data set describing the skills generally used in occupations was used to identify occupations that involve a high level of "thinking creatively“ „developing, designing, or creating new applications, ideas, relationships, systems, or products, including artistic contributions." data from the 1990 and 2000 Census of Population was compiled for 3,139 counties; the share of the employed population 16 years and older in creative occupations represents the ERS measure of creative class

12
REGRESSION ANALYSIS INDEPENDENT VARIABLE: the share of people with creative occupations (per state) DEPENDENT VARIABLE: real GSP per capita
 DEPENDENT VARIABLE: real GSP per capita")
13
CREATIVITY AND GROWTH IN 1990

14
CREATIVITY IN 1990

15
CREATIVITY AND GROWTH IN 2000

16
CREATIVITY IN 2000

19
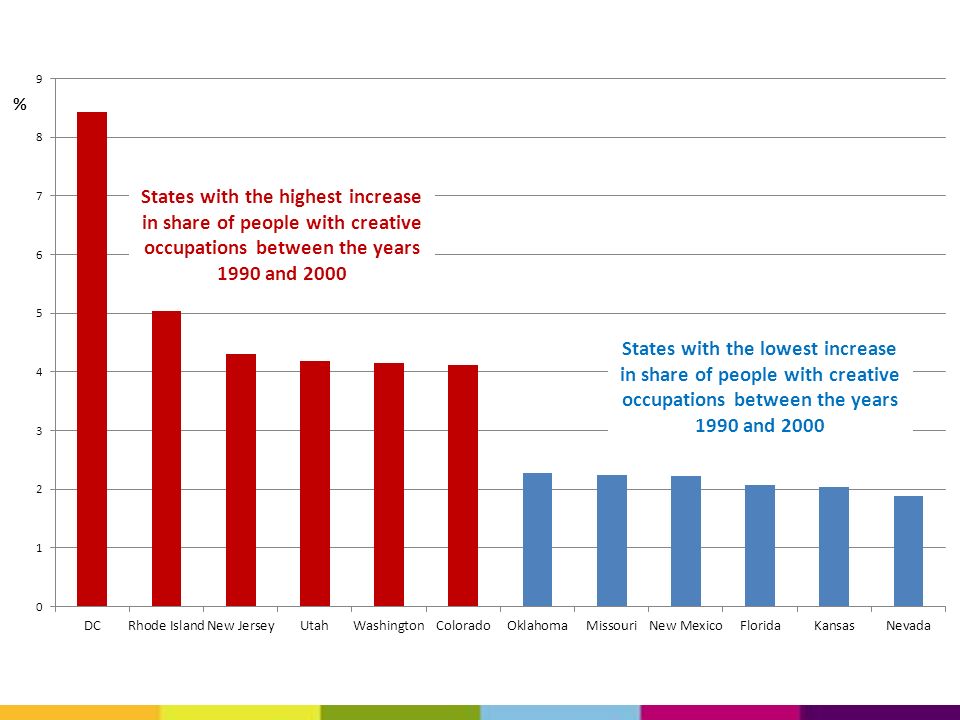
CREATIVITY AND GROWTH 1990/2000

20
GOOGLE DOCS

21
REGRESSION ANALYSIS RESULTS: What does this mean? 1999 2000 y = 1920,6x - 2621,8 R² = 0,4246 y = 1897,2x – 1886 R² = 0,577

22
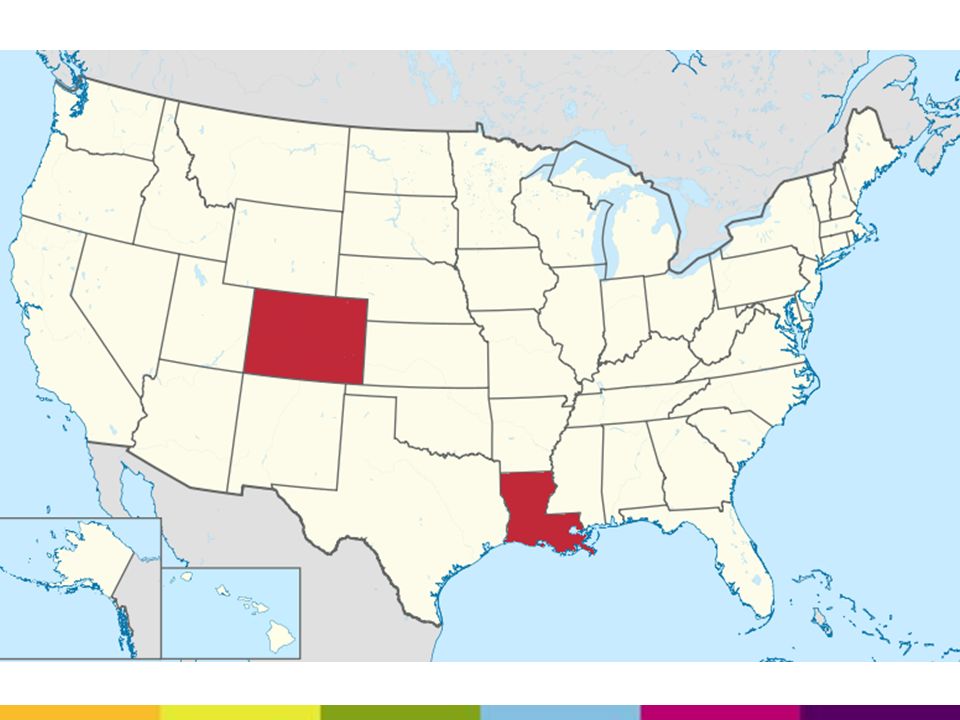
COLORADO versus LOUISIANA

23
GOOGLE DOCS

24
CASE STUDY LOUISIANA versus COLORADO

26
CREATIVITY INDEX of COLORADO and LOUISIANA

27
1.) Share of Creative Class (Creativity Index)
 Share of Creative Class (Creativity Index)")
28
Top Ten Creative States – Investments in R&D

29
2.) High-tech Index / State Technology and Science Index (Creativity Index) Over all ranking: Colorado #3, Louisiana #45 Human Capital Investment Composite Index CO 3, LA 41 Research and Development Inputs Composite Index CO 5, LA 47 Risk Capital and Entrepreneurial Infrastructure Composite CO 6, LA 33 Technology and Science Work Force Composite Index CO 5, LA 47 Technology Concentration and Dynamism Composite Index CO 2, LA 37
 High-tech Index / State Technology and Science Index (Creativity Index) Over all ranking: Colorado #3, Louisiana #45 Human Capital Investment Composite Index CO 3, LA 41 Research and Development Inputs Composite Index CO 5, LA 47 Risk Capital and Entrepreneurial Infrastructure Composite CO 6, LA 33 Technology and Science Work Force Composite Index CO 5, LA 47 Technology Concentration and Dynamism Composite Index CO 2, LA 37")
30
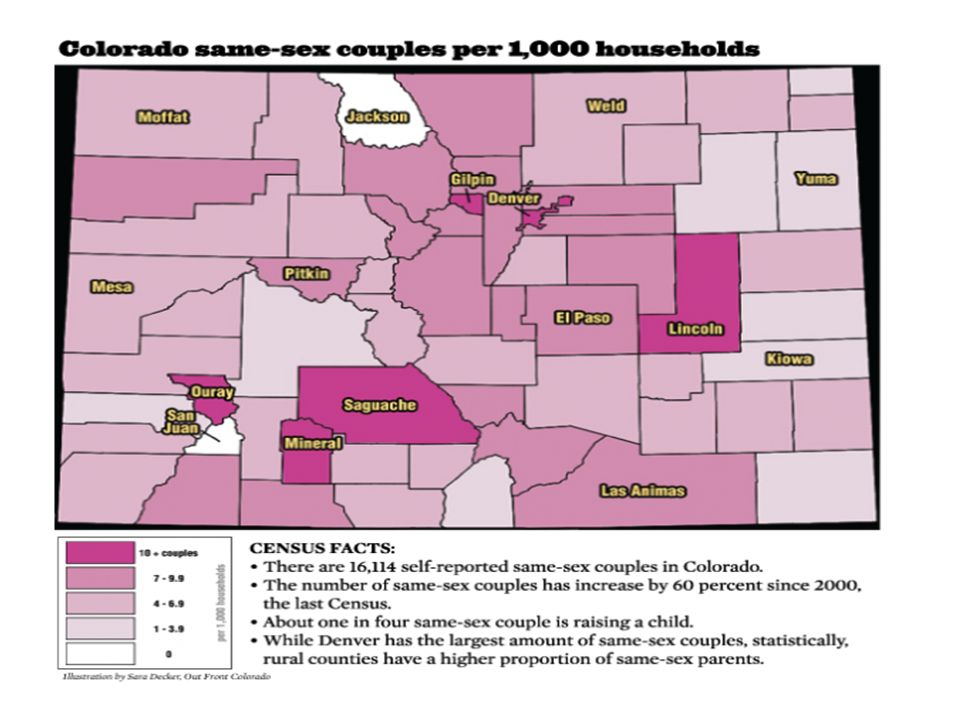
3.) Gay Index (Diversity Index) The higher the % of gay population there is, the more attractive region for the creative class Open and diverse society
 Gay Index (Diversity Index) The higher the % of gay population there is, the more attractive region for the creative class Open and diverse society")
31
Percent of same-sex couples who are interracial or interethnic Source: Census Data 2010

33
The higher the Gay Index, the higher hourly-income

34
Patent per capita indicator Colorado: #15 6.7 per 1 000 people 1848 patents in 2000 2102 patents in 2011 Louisiana: #39 2.60 per 1 000 people 518 patents in 2000 308 patents in 2011

35
Colorado v. Louisiana Population: 5,11 mil. Percentage change of GSP: 43,68% Creative class percentage change: 4,11% Percentage of graduates, rank: 53,3%, 29th Population: 4,57 mil. Percentage change of GSP: 4,52% Creative class percentage change: 2,34% Percentage of graduates, rank: 40,7%, 47th

36
COLORADO - Creative Industries - 5th largest employment sector - 122,000 individuals in about 8,000 establishments ->3.9% of the state’s estimated 3.2 million jobs - generated earnings about $5 billion - 64,000 individuals worked in creative occupations in non-creative enterprises - 5th among all states for concentration of artists (after NY, CA, MA, VT) - 2nd in concentration of architects - 7th in concentration of writers, designers, entertainers and performers - 8th in concentration of photographers
 - 2nd in concentration of architects - 7th in concentration of writers, designers, entertainers and performers - 8th in concentration of photographers")
38
State Programs (CO) - Colorado Creative Districts Program - StART (Succes through Art) - Colorado Creates Grants - Peer Assistance Network (PAN) - Art in Public Places ActColorado - Film Incentives Cash Fund - Sound Recording Investor Tax Credit
 - Colorado Creative Districts Program - StART (Succes through Art) - Colorado Creates Grants - Peer Assistance Network (PAN) - Art in Public Places ActColorado - Film Incentives Cash Fund - Sound Recording Investor Tax Credit")
39
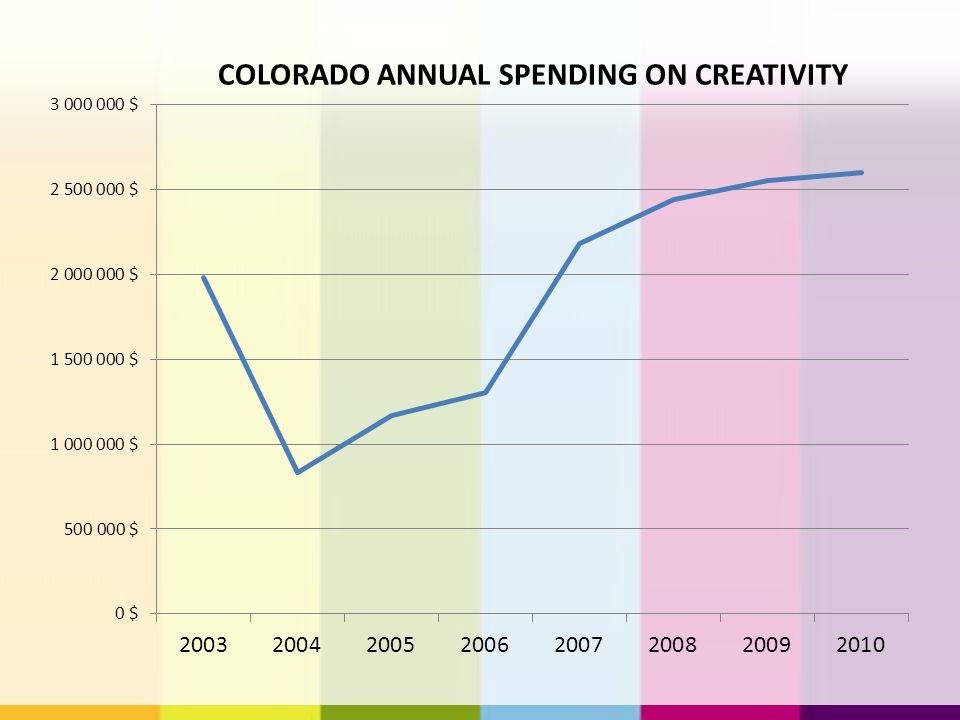
Annual spendings on Creative Class: Colorado FY 2003: $1,980,075 FY 2004: $832,658 (significant federal cuts, 7 of 8 staff positions of Colorado Creative Industries, Colorado Office of Economic Development and International Trade, eliminated) FY 2005: $1,169,315 (recovery) FY 2006: $1,302,838 FY 2007: $2,182,269 FY 2008: $2,440,496 FY 2009: $2,552,885 FY 2010: $2,596,975
 FY 2005: $1,169,315 (recovery) FY 2006: $1,302,838 FY 2007: $2,182,269 FY 2008: $2,440,496 FY 2009: $2,552,885 FY 2010: $2,596,975")
41
LOUISIANA - absence of state programs - Louisiana Department of Culture, Recreation and Tourism - lack of political will - e.g. "Cultural Economy Initiative" - the official webpage of Louisiana Government

43
STATE PROGRAMS (LA) Eight Key Industries: - advanced manufacturing - agribusiness - clean-tech - digital media and software - tax incentive - energy - entertainment - Motion Picture Industry Development Tax Credit - speciality health care - water management
 Eight Key Industries: - advanced manufacturing - agribusiness - clean-tech - digital media and software - tax incentive - energy - entertainment - Motion Picture Industry Development Tax Credit - speciality health care - water management")
44
SOURCES Creative Class County Codes. Economic Research Service of US Department of Agriculture [online] October 17, 2007 Accessed on May 4, 2012. The 2006 Statistical Abstract. United States Census Bureau [online] Accessed on May 4, 2012. Population of States and Counties of the United States: 1790 to 1990. United States Census Bureau [online] Accessed on May 4, 2012. Selected Historical Decennial Census Population and Housing Counts. United States Census Bureau [online] Accessed on May 4, 2012. Ranking Tables for States: Population in 2000 and Population Change from 1990 to 2000. United States Census Bureau [online] Accessed on May 4, 2012.

45
SOURCES http://www.crt.state.la.us/initiatives/culturaleconomy/w elcome.html http://louisiana.gov/Services/ http://www.louisianaeconomicdevelopment.com/key- industries.aspx http://www.higheredinfo.org/dbrowser/index.php?subm easure=27&year=2009&level=nation&mode=graph&st ate=0 http://www.coloradocreativeindustries.org/ http://www.coloradocreativeindustries.org/news/report/

46
NOTES Regression analysis: it would be interested to show the correlation for other industries as well (to see if the R2 is the same or not) Creative class should not go against working class (manufacturing; in the US, many regions lost their manufacturing industry and now have problems with innovation and employment)
 Creative class should not go against working class (manufacturing; in the US, many regions lost their manufacturing industry and now have problems with innovation and employment)")
Similar presentations


>")


