Download presentation
Presentation is loading. Please wait.

1
Participant Presentations Draft Schedule Now on Course Web Page: https://stor893spring2016.web.unc.edu/ When You Present: Please Load Talk on Classroom Computer Before Class

2
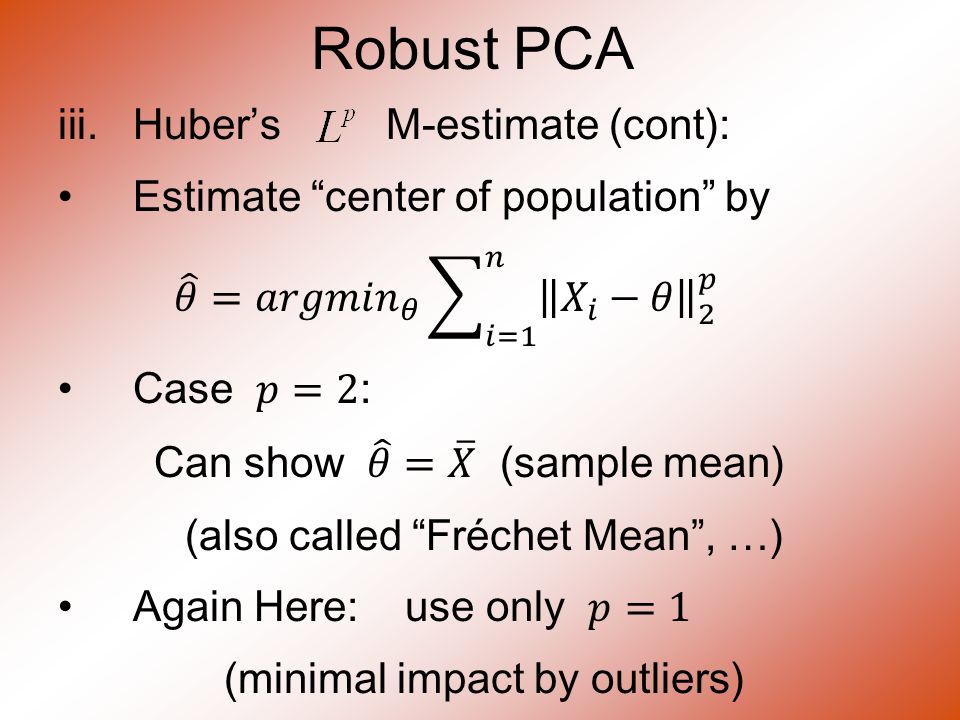
HDLSS Math. Stat. of PCA Due to Dan Shen

3
PC Scores (i.e. projections) Not Consistent So how can PCA find Useful Signals in Data? Key is “Proportional Errors” Axes have Inconsistent Scales, But Relationships are Still Useful HDLSS Math. Stat. of PCA

4
HDLSS & Sparsity

5
1 1 0 0 0 ≤ β ≤1 0.7 0.5 0.3 0.1 0.2 0.4 0.6 0.8 Spike Index Sparsity Index 0≤ α < β ≤1 0≤β<α≤1 Jung and Marron 0≤ α = β ≤1 Sparse PCA: Inconsistent & New Consistency Region

6
Sparse PCA Opens Up Whole New Region of Consistency HDLSS & Sparsity

7
HDLSS & Other Asymptotics

8
Question: Which Statistic to Summarize Projections? 2 – Sample t statistic Mean Difference HDLSS Analysis of DiProPerm

9
Yet both have mean 0 Reason: Less spread for original projection E.g. Both i.i.d with t(5) marginal t-test summary rejects HDLSS Analysis of DiProPerm
 marginal t-test summary rejects HDLSS Analysis of DiProPerm.")
11
Cornea Data Main Point: OODA Beyond FDA Recall Interplay: Object Space Descriptor Space

12
Cornea Data Cornea: Outer surface of the eye Driver of Vision: Curvature of Cornea Data Objects: Images on the unit disk Radial Curvature as “ Heat Map ” Special Thanks to K. L. Cohen, N. Tripoli, UNC Ophthalmology

13
Cornea Data Cornea Data: Raw Data Decompose Into Modes of Variation?

14
Cornea Data Data Representation - Zernike Basis Pixels as features is large and wasteful Natural to find more efficient represent ’ n Polar Coordinate Tensor Product of: –Fourier basis (angular) –Special Jacobi (radial, to avoid singularities) See: –Schwiegerling, Greivenkamp & Miller (1995) –Born & Wolf (1980)
 –Special Jacobi (radial, to avoid singularities) See: –Schwiegerling, Greivenkamp & Miller (1995) –Born & Wolf (1980)")
15
Cornea Data Data Representation - Zernike Basis Descriptor Space is Vector Space of Zernike Coefficients So Perform PCA There

16
PCA of Cornea Data Recall: PCA can find (often insightful) direction of greatest variability Main problem: display of result (no overlays for images) Solution: show movie of “ marching along the direction vector ”
 direction of greatest variability Main problem: display of result (no overlays for images) Solution: show movie of marching along the direction vector")
17
PCA of Cornea Data PC1 Movie:

18
PCA of Cornea Data PC1 Summary: Mean (1 st image): mild vert ’ l astigmatism known pop ’ n structure called “ with the rule ” Main dir ’ n: “ more curved ” & “ less curved ” Corresponds to first optometric measure (89% of variat ’ n, in Mean Resid. SS sense) Also: “ stronger astig ’ m ” & “ no astig ’ m ” Found corr ’ n between astig ’ m and curv ’ re Scores (cyan): Apparent Gaussian dist ’ n
 Also: stronger astig ’ m & no astig ’ m Found corr ’ n between astig ’ m and curv ’ re Scores (cyan): Apparent Gaussian dist ’ n.")
19
PCA of Cornea Data PC2 Movie:

20
PCA of Cornea Data PC2 Movie: Mean: same as above Common centerpoint of point cloud Are studying “ directions from mean ” Images along direction vector: Looks terrible??? Why?

21
PCA of Cornea Data PC2 Movie: Reason made clear in Scores Plot (cyan): Single outlying data object drives PC dir ’ n A known problem with PCA Recall finds direction with “ max variation ” In sense of variance Easily dominated by single large observat ’ n
: Single outlying data object drives PC dir ’ n A known problem with PCA Recall finds direction with max variation In sense of variance Easily dominated by single large observat ’ n")
22
PCA of Cornea Data Toy Example: Single Outlier Driving PCA

23
PCA of Cornea Data PC2 Affected by Outlier: How bad is this problem? View 1: Statistician: Arrggghh!!!! Outliers are very dangerous Can give arbitrary and meaningless dir ’ ns

24
PCA of Cornea Data PC2 Affected by Outlier: How bad is this problem? View 2: Ophthalmologist: No Problem Driven by “ edge effects ” (see raw data) Artifact of “ light reflection ” data gathering ( “ eyelid blocking ”, and drying effects) Routinely “ visually ignore ” those anyway Found interesting (& well known) dir ’ n: steeper superior vs steeper inferior
 Artifact of light reflection data gathering ( eyelid blocking , and drying effects) Routinely visually ignore those anyway Found interesting (& well known) dir ’ n: steeper superior vs steeper inferior.")
25
Outliers in PCA PCA for Deeper Toy E.g. Data:

26
Outliers in PCA

28
Controversy: Is median ’ s “ equal vote ” scheme good or bad? Huber: Outliers contain some information, So should only control “ influence ” (e.g. median) Hampel, et. al.: Outliers contain no useful information Should be assigned weight 0 (not done by median) Using “ proper robust method ” (not simply deleted)
 Hampel, et. al.: Outliers contain no useful information Should be assigned weight 0 (not done by median) Using proper robust method (not simply deleted).")
29
Outliers in PCA

30
Robust PCA What is multivariate median? There are several! ( “ median ” generalizes in different ways) i.Coordinate-wise median Often worst Not rotation invariant (2-d data uniform on “ L ” ) Can lie on convex hull of data (same example) Thus poor notion of “ center ”
 i.Coordinate-wise median Often worst Not rotation invariant (2-d data uniform on L ) Can lie on convex hull of data (same example) Thus poor notion of center .")
31
Robust PCA i.Coordinate-wise median Not rotation invariant Thus poor notion of “ center ”

32
Robust PCA i.Coordinate-wise median Can lie on convex hull of data Thus poor notion of “ center ”

33
Robust PCA

38
M-estimate (cont.): Data are + signs
: Data are + signs")
39
Robust PCA

43
M-estimate (cont.): “ Slide sphere around until mean (of projected data) is at center ”
: Slide sphere around until mean (of projected data) is at center")
44
Robust PCA

45
M-estimate for Cornea Data: Sample Mean M-estimate Definite improvement But outliers still have some influence Improvement? (will suggest one soon)
.")
46
Robust PCA Now have robust measure of “ center ”, how about “ spread ” ? I.e. how can we do robust PCA?

47
Robust PCA Now have robust measure of “ center ”, how about “ spread ” ? Parabs e.g. from above With an “outlier” (???) Added in
 Added in.")
48
Robust PCA Now have robust measure of “ center ”, how about “ spread ” ? Small Impact on Mean

49
Robust PCA Now have robust measure of “ center ”, how about “ spread ” ? Small Impact on Mean More on PC1 Dir’n

50
Robust PCA Now have robust measure of “ center ”, how about “ spread ” ? Small Impact on Mean More on PC1 Dir’n Dominates Residuals Thus PC2 Dir’n & PC2 scores

51
Robust PCA Now have robust measure of “ center ”, how about “ spread ” ? Small Impact on Mean More on PC1 Dir’n Dominates Residuals Thus PC2 Dir’n & PC2 scores Tilt now in PC3 Viualization is very Useful diagnostic

52
Robust PCA Now have robust measure of “ center ”, how about “ spread ” ? How can we do robust PCA?

53
Robust PCA Approaches to Robust PCA: 1.Robust Estimation of Covariance Matrix 2.Projection Pursuit 3.Spherical PCA

54
Robust PCA

55
Important Aside

56
Classical Approach to HDLSS data: “ Don ’ t have enough data for analysis, get more ” Unworkable (and getting worse) for many modern settings: Medical Imaging (e.g. Cornea Data) Micro-arrays & gene expression Chemometric spectra data
 Micro-arrays & gene expression Chemometric spectra data.")
57
Robust PCA Robust PCA 2: Projection Pursuit Idea: focus on “ finding direction of greatest variability ” Reference: Li and Chen (1985) Problems: Robust estimates of “ spread ” are nonlinear Results in many local optima
 Problems: Robust estimates of spread are nonlinear Results in many local optima")
58
Robust PCA

59
Robust PCA 3: Spherical PCA Locantore et al (1999)
")
60
Robust PCA Robust PCA 3: Spherical PCA Idea: use “ projection to sphere ” idea from M-estimation In particular project data to centered sphere “ Hot Dog ” of data becomes “ Ice Caps ” Easily found by PCA (on proj ’ d data) Outliers pulled in to reduce influence Radius of sphere unimportant
 Outliers pulled in to reduce influence Radius of sphere unimportant")
61
Robust PCA

62
Robust PCA 3: Spherical PCA Independent Derivation & Alternate Name: PCA of Spatial Signs 1 st Paper: Möttönen & Oja (1995) Complete Description: Oja (2010)
 Complete Description: Oja (2010)")
63
Robust PCA Spatial Signs Interesting Variation: Spatial Ranks Idea: Keep Track of “Depth” Via Ranks of Radii

64
Robust PCA Spherical PCA for Toy Example: Curve Data With an Outlier First recall Conventional PCA

65
Robust PCA Spherical PCA for Toy Example: Now do Spherical PCA Better result?

66
Robust PCA Spherical PCA for Toy Data: Mean looks “ smoother ” PC1 nearly “ flat ” (unaffected by outlier) PC2 is nearly “ tilt ” (again unaffected by outlier) PC3 finally strongly driven by outlier OK, since all other directions “ about equal in variation ” Energy Plot, no longer ordered (outlier drives SS, but not directions)
 PC2 is nearly tilt (again unaffected by outlier) PC3 finally strongly driven by outlier OK, since all other directions about equal in variation Energy Plot, no longer ordered (outlier drives SS, but not directions)")
67
Robust PCA Spherical PCA for Toy Example: Check out Later Components

68
Aside On Visualization

70
Robust PCA Useful View: Parallel Coordinates Plot X-axis: Zernike Coefficient Number Y-axis: Coefficient

71
Robust PCA Cornea Data, Parallel Coordinates Plot: Top Plot: Zernike Coefficients

72
Robust PCA Cornea Data, Parallel Coordinates Plot: Top Plot: Zernike Coefficients All n = 43 very Similar.

73
Robust PCA Cornea Data, Parallel Coordinates Plot: Top Plot: Zernike Coefficients All n = 43 very Similar Most Action in few Low Freq. Coeffs.

74
Robust PCA Cornea Data, Parallel Coordinates Plot Middle Plot: (Zernike Coefficients – median) Most Variation in lowest frequencies E.g. as in Fourier compression of smooth signals Projecting on sphere will destroy this By magnifying high frequency behavior Bottom Plot: discussed later

75
Robust PCA Spherical PCA Problem : Magnification of High Freq. Coeff ’ s Solution : Elliptical Analysis Main idea: project data onto suitable ellipse, not sphere Which ellipse? (in general, this is problem that PCA solves!) Simplification: Consider ellipses parallel to coordinate axes
 Simplification: Consider ellipses parallel to coordinate axes.")
76
Robust PCA

77
Rescale Coords Unscale Coords Spherical PCA

78
Robust PCA Elliptical Analysis (cont.): Simple Implementation, via coordinate axis rescaling Divide each axis by MAD Project Data to sphere (in transformed space) Return to original space (mul ’ ply by orig ’ l MAD) for analysis Do PCA on Projections
: Simple Implementation, via coordinate axis rescaling Divide each axis by MAD Project Data to sphere (in transformed space) Return to original space (mul ’ ply by orig ’ l MAD) for analysis Do PCA on Projections")
79
Robust PCA Elliptical Estimate of “ center ” : Do M-estimation in transformed space (then transform back) Results for cornea data: Sample Mean Spherical Center Elliptical Center Elliptical clearly best Nearly no edge effect
 Results for cornea data: Sample Mean Spherical Center Elliptical Center Elliptical clearly best Nearly no edge effect")
80
Robust PCA Elliptical PCA for cornea data: Original PC1, Elliptical PC1

81
Robust PCA Elliptical PCA for cornea data: Original PC1, Elliptical PC1 Still finds overall curvature & correlated astigmatism Minor edge effects almost completely gone

82
Robust PCA Elliptical PCA for cornea data: Original PC2, Elliptical PC2

83
Robust PCA Elliptical PCA for cornea data: Original PC1, Elliptical PC1 Still finds overall curvature & correlated astigmatism Minor edge effects almost completely gone Original PC2, Elliptical PC2 Huge edge effects dramatically reduced Still finds steeper superior vs. inferior

84
Robust PCA Elliptical PCA for cornea data: Original PC3, Elliptical PC3

85
Robust PCA Elliptical PCA for Cornea Data (cont.): Original PC3, Elliptical PC3 -Edge effects greatly diminished But some of against the rule astigmatism also lost Price paid for robustness
: Original PC3, Elliptical PC3 -Edge effects greatly diminished But some of against the rule astigmatism also lost Price paid for robustness")
86
Robust PCA Elliptical PCA for cornea data: Original PC4, Elliptical PC4

87
Robust PCA Elliptical PCA for Cornea Data (cont.): Original PC3, Elliptical PC3 -Edge effects greatly diminished But some of against the rule astigmatism also lost Price paid for robustness Original PC4, Elliptical PC4 Now looks more like variation on astigmatism???
: Original PC3, Elliptical PC3 -Edge effects greatly diminished But some of against the rule astigmatism also lost Price paid for robustness Original PC4, Elliptical PC4 Now looks more like variation on astigmatism")
88
Robust PCA Current state of the art: Spherical & Elliptical PCA are a kludge Put together by Robustness Amateurs To solve this HDLSS problem Good News: Robustness Pros are now in the game: Maronna, et al (2006), Sec. 6.10.2

89
Robust PCA

90
Big Picture View of PCA Above View: PCA finds optimal directions in point cloud

91
Big Picture View of PCA Above View: PCA finds optimal directions in point cloud

92
Big Picture View of PCA Above View: PCA finds optimal directions in point cloud Maximize projected variation Minimize residual variation (same by Pythagorean Theorem) Notes: Get useful insights about data Can compute for any point cloud But there are other views.
 Notes: Get useful insights about data Can compute for any point cloud But there are other views.")
93
Big Picture View of PCA Alternate Viewpoint: Gaussian Likelihood

94
Big Picture View of PCA Alternate Viewpoint: Gaussian Likelihood

95
Big Picture View of PCA Alternate Viewpoint: Gaussian Likelihood When data are multivariate Gaussian PCA finds major axes of ellipt ’ al contours of Probability Density Maximum Likelihood Estimate

96
Big Picture View of PCA Alternate Viewpoint: Gaussian Likelihood Maximum Likelihood Estimate

97
Big Picture View of PCA Alternate Viewpoint: Gaussian Likelihood When data are multivariate Gaussian PCA finds major axes of ellipt ’ al contours of Probability Density Maximum Likelihood Estimate Mistaken idea: PCA only useful for Gaussian data

98
Big Picture View of PCA Simple check for Gaussian distribution: Standardized parallel coordinate plot Subtract coordinate wise median (robust version of mean) (not good as “ point cloud center ”, but now only looking at coordinates) Divide by MAD / MAD(N(0,1)) (put on same scale as “ standard deviation ” ) See if data stays in range – 3 to +3
 (not good as point cloud center , but now only looking at coordinates) Divide by MAD / MAD(N(0,1)) (put on same scale as standard deviation ) See if data stays in range – 3 to +3")
99
Big Picture View of PCA E.g. Cornea Data: Standardized Parallel Coordinate Plot Shown before

100
Big Picture View of PCA Raw Cornea Data: Data – Median (Data – Median) ------------------- MAD
 MAD")
101
Big Picture View of PCA Check for Gaussian dist ’ n: Stand ’ zed Parallel Coord. Plot E.g. Cornea data (recall image view of data) Several data points > 20 “ s.d.s ” from the center Distribution clearly not Gaussian Strong kurtosis ( “ heavy tailed ” ) But PCA still gave strong insights
 Several data points > 20 s.d.s from the center Distribution clearly not Gaussian Strong kurtosis ( heavy tailed ) But PCA still gave strong insights.")
102
Big Picture View of PCA Mistaken idea: PCA only useful for Gaussian data Toy Example: Each Marginal Binary Clearly NOT Gaussian n = 100, d = 4000

103
Big Picture View of PCA Mistaken idea: PCA only useful for Gaussian data But PCA Reveals Trimodal Structure

104
GWAS Data Analysis

105
Genome Wide Association Study (GWAS) Cystic Fibrosis Study: Wright et al (2011) Interesting Feature: Some Subjects are Close Relatives (e.g. ~half SNPs are same)
.")
106
GWAS Data Analysis PCA View Clear Ethnic Groups

107
GWAS Data Analysis PCA View Clear Ethnic Groups And Several Outliers! Eliminate With Spherical PCA?

108
GWAS Data Analysis Spherical PCA Looks Same?!? What is going on?

109
GWAS Data Analysis

111
L1 Statistics E.g. Simple Linear Regression Replace Best L2 Fit

112
L1 Statistics E.g. Simple Linear Regression Replace Best L2 Fit With Best L1 Fit

113
L1 Statistics E.g. Simple Linear Regression Best L1 Fit Advantages: Robust Against Outliers Good “Sparsity” Properties

114
L1 PCA Calculation: Clever “backwards” algorithm Brooks, Dulá, Boone (2013)
")
115
L1 PCA Challenge: L1 Projections Hard to Interpret 2-d Toy Example Note Outlier

116
L1 PCA Challenge: L1 Projections Hard to Interpret Parallel Coordinate View

117
L1 PCA Conventional L2 PCA Outlier Pulls Off PC1 Direction

118
L1 PCA Much Better PC1 Direction

119
L1 PCA Much Better PC1 Direction But Vary Strange Projections (i.e. Little Data Insight)
")
120
L1 PCA Reason: SVD Rotation Before L1 Computation Note: L1 Methods Not Rotation Invariant

Similar presentations


>")


>")
 Distribution of values for single variables.>")


