Download presentation
Presentation is loading. Please wait.

1
Astronomy: HR Diagrams EQ: How does the HR Diagram show different stages in the life cycle of a star? ** Copy all purple and red words. p. 81

2
Hertzsprung-Russell Diagrams HR Diagrams

3
Basics of the HR diagram In a Hertzsprung-Russell diagram, each star is represented by a dot. One uses data from lots of stars, so there are lots of dots. The position of each dot on the diagram corresponds to the star's luminosity and its temperature. The vertical position represents the star's luminosity (brightness). The horizontal position represents the star's surface temperature.
. The horizontal position represents the star s surface temperature..")
4
When data on the nearest stars to us or stars in a cluster are plotted in a HR diagram, here is what one sees:

5
Most stars fall on a band, called the main sequence. There are some stars that are not on the main sequence. They are very interesting, but for now, let's concentrate on the main sequence. The question is, why is there a main sequence?

6
Temperature, size and luminosity Hotter things are brighter. – Energy radiated per unit time per unit area is proportional to T 4, – so bigger T means more energy radiated Bigger things are brighter. – Energy radiated per unit time per unit area is proportional to T 4, – so bigger surface area means more energy radiated.

7
The coolest main sequence stars are a lot smaller than the sun. The hottest main sequence stars are a lot bigger than the sun.

8
Stars spend most of their lives as main sequence stars. During its lifetime, the surface temperature and luminosity stays pretty much constant. – Something else could happen in the star birth process. – Something else could happen in the star death process. The star's mass determines what the temperature and luminosity is during the star's main sequence lifetime. – More mass -> hotter. – More mass -> more luminous. – Also, more mass -> bigger.

9
Hertzsprung – Russell Diagram

10
Consider stars cooler than, but brighter than the sun. These must be very large stars (Red Giants), whereas stars bluer than the sun but less luminous must be quite small ( White Dwarfs).
, whereas stars bluer than the sun but less luminous must be quite small ( White Dwarfs)..")
11
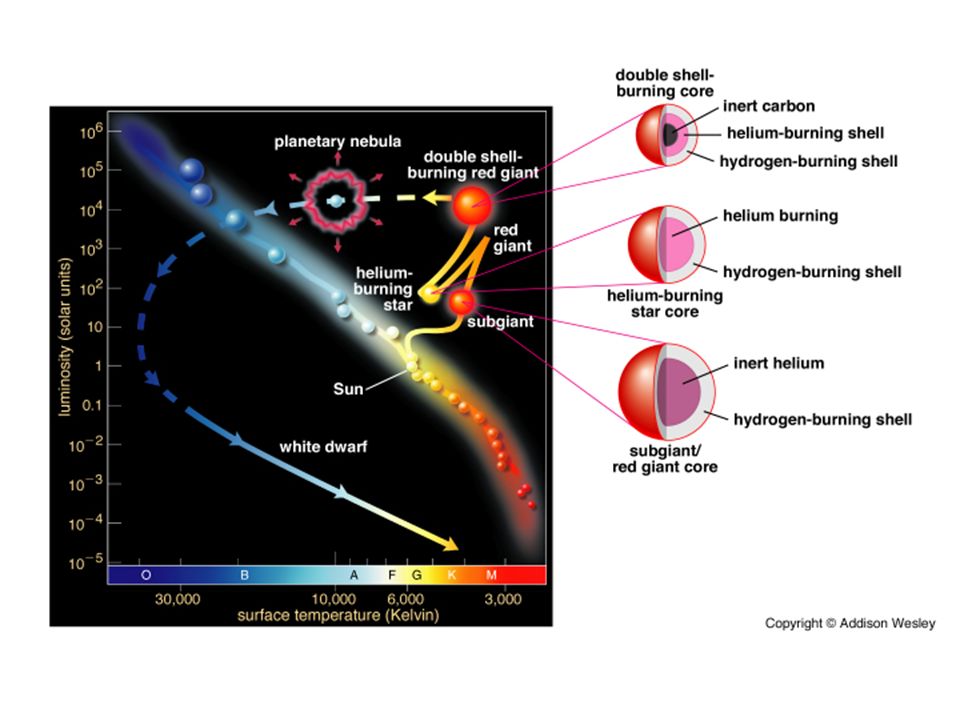
The Hertzsprung-Russell Diagram is a graphical tool that astronomers use to classify stars according to their luminosity, spectral type, color, temperature and evolutionary stage. Stars in the stable phase of hydrogen burning lie along the Main Sequence according to their mass. hydrogen burning After a star uses up all the hydrogen in its core, it leaves the main sequence and moves towards the red giant branch. The most massive stars may also become red supergiants, in the upper right corner of the diagram. The lower left corner is reserved for the white dwarfs.

13
Star Life Cycles & the H-R Diagram We will see that the H-R Diagram is an extremely useful way to follow the changes that take place as a star evolves. Most stars are on the Main Sequence because that is where stars spend most of their lives, burning hydrogen to helium through nuclear reactions. As stars live out their lives, changes in the structure of the star are reflected in changes in stars temperatures, sizes and luminosities, which cause them to move in tracks on the H-R Diagram.

14
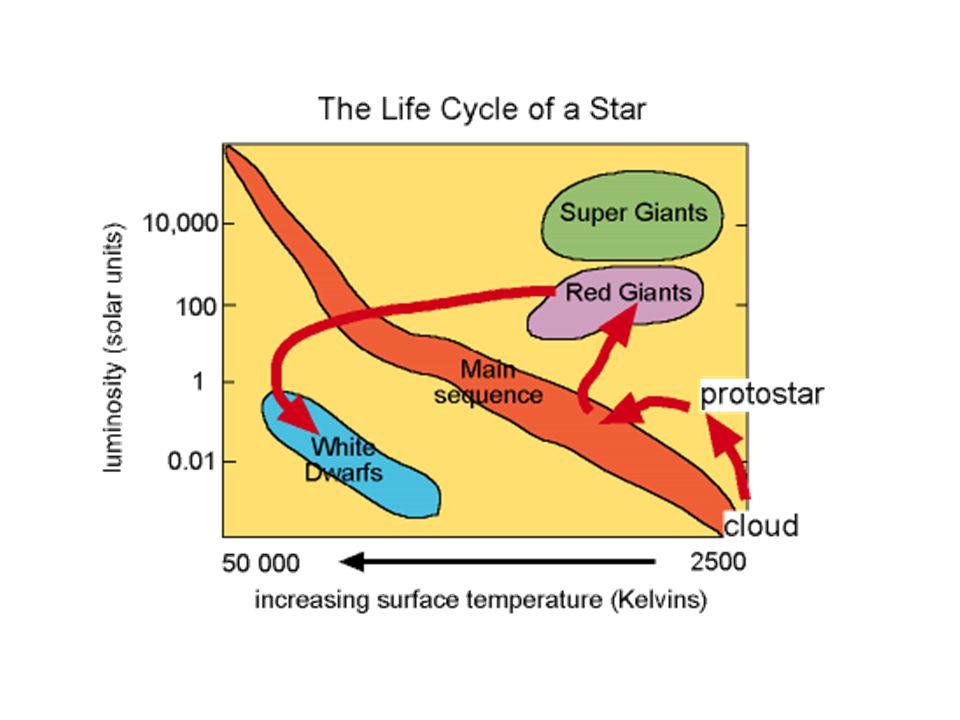
A simplified illustration of the evolution of a star with the mass of the Sun. The star forms from a collapsing cloud of gas (1), and then undergoes a contraction period as a protostar (2), before joining the main sequence (3). Once the Hydrogen at the core is consumed it expands into a red giant (4), then sheds its envelope into a planetary nebula and degenerates into a white dwarf (5).
, and then undergoes a contraction period as a protostar (2), before joining the main sequence (3). Once the Hydrogen at the core is consumed it expands into a red giant (4), then sheds its envelope into a planetary nebula and degenerates into a white dwarf (5)..")
Similar presentations


>")


 Huge stars (6 - 30.>")
 held together.>")

 Diagram.>")