Download presentation
Presentation is loading. Please wait.

1
Chapter 9 : Development The Cultural Landscape: An Introduction to Human Geography

2
© 2011 Pearson Education, Inc. warm up What are the 3 sectors of the economy? Give 2 actual examples of each sector.

3
Economic Geography Money-making activities

4
Why Does Development Vary Among Countries? Economic indicators of development Types of jobs Primary sector Secondary sector Tertiary sector Quaternary sector (knowledge-based: IT, consultation, education, R&D) ?Quinary sector? (health, culture, and research)
 Quinary sector. (health, culture, and research).")
5
Any activity where a natural resource (raw material) is used directly for profit. Farming Fishing Mining Logging Primary activities

6
Secondary activities When raw materials are taken to produce or manufacture a product. Iron and Coal (extracted – primary) produces Steel Steel produces thousands of parts for machinery of all kinds. (automobiles) Cotton is harvested (primary) Taken to a factory and made into clothes
 produces Steel Steel produces thousands of parts for machinery of all kinds. (automobiles) Cotton is harvested (primary) Taken to a factory and made into clothes.")
7
Tertiary (Service) activities Anything that provides a product or service to the public. Largest sector of an MDC country today. Banking, education, medicine, retail or wholesale sales, food service, military, insurance, entertainment

8
Quaternary Sector (a branch of the Tertiary Sector) Involves the collection, processing, and manipulation of information. Engineering Research and development Information technology Software Web design Support

9
Quinary Sector (a further branch of the Tertiary Sector, Quaternary) The quinary sector of the economy is defined by some to as the highest level of intellectual efforts where major world decisions are made. Health Culture Research Politics

10
© 2011 Pearson Education, Inc. Why does development vary among countries? Why does development vary by gender? Why is energy important for development? Why do countries face obstacles to development? Key Issues

11
Development The process of improving the material conditions of people through the diffusion of knowledge and technology More developed countries (MDCs) AKA developed countries, Core Countries, “1 st world” Newly Industrialized Countries (NICs) AKA semi-periphery countries Lesser developed countries (LDCs) AKA emerging or developing countries, periphery, “3 rd world”
 AKA developed countries, Core Countries, 1 st world Newly Industrialized Countries (NICs) AKA semi-periphery countries Lesser developed countries (LDCs) AKA emerging or developing countries, periphery, 3 rd world")
12
Where are MDCs and LDCs Distributed? More developed regions North America and Europe Other MDCs with high HDI = Russia, Japan, Australia, and New Zealand Less developed regions Latin America = highest HDI among LDCs Southwest Asia, Southeast Asia, Central Asia = similar HDI South Asia and sub-Saharan Africa = low levels of development

13
Why Does Development Vary Between Countries? United Nations (UN) developed a metric to measure the level of development of every country called the Human Development Index (HDI). It is based on three factors: 1.Decent standard of living 2.Long and healthy life 3.Access to knowledge Countries group into 4 classes Level of development ranging from developed (Very High) to developing (Low).
 developed a metric to measure the level of development of every country called the Human Development Index (HDI). It is based on three factors: 1.Decent standard of living 2.Long and healthy life 3.Access to knowledge Countries group into 4 classes Level of development ranging from developed (Very High) to developing (Low)..")
14
Human Development Index

15
© 2011 Pearson Education, Inc.

16
What is “human development”?

17
© 2011 Pearson Education, Inc. Why Does Development Vary among Countries? A Decent Standard of Living UN measures standard of living based on two functions: 1.Gross national income (GNI) Value of the output of goods and services produced in a country annually, including money that leaves and enters the country. Gross domestic product (GDP) is similar except it doesn’t account for money entering and leaving the country. Per capita GNI measures average (mean) wealth, not its distribution among citizens. 2.Purchasing power parity (PPP) Cost of living adjustment made to the GNI.
 Value of the output of goods and services produced in a country annually, including money that leaves and enters the country. Gross domestic product (GDP) is similar except it doesn’t account for money entering and leaving the country. Per capita GNI measures average (mean) wealth, not its distribution among citizens. 2.Purchasing power parity (PPP) Cost of living adjustment made to the GNI..")
18
© 2011 Pearson Education, Inc. GNI PPP per capita

19
© 2011 Pearson Education, Inc. Why Does Development Vary among Countries? A Long and Healthy Life UN considers good health to be an important measure of development: Main health indicator contribution to the HDI is life expectancy at birth. Average life expectancies of a baby Global average: 70 years Developed country: 80 years Developing country: 68 years

20
© 2011 Pearson Education, Inc.

21
Why Does Development Vary among Countries? Access to Knowledge UN considers years of schooling to be the most critical measure of the ability of an individual to gain access to knowledge needed for development. Quantity of Schooling Average Years of schooling Global: 7 years Developing: 6 years Developed: 11 years Expected years of schooling Developed: 16 years Developing: 11 years

22
© 2011 Pearson Education, Inc. Mean years of schooling

23
© 2011 Pearson Education, Inc. Expected years of schooling

24
© 2011 Pearson Education, Inc. Why Does Development Vary among Countries? Access to Knowledge cont’d: Quality of Schooling Pupil/teacher ratio Global: 24 (primary school) Developing: 26 (primary school) Developed: 14 (primary school) Literacy rate Developed: >99% Developing: 70-90%
 Developing: 26 (primary school) Developed: 14 (primary school) Literacy rate Developed: >99% Developing: 70-90%.")
25
© 2011 Pearson Education, Inc. Pupil/teacher ratio

26
© 2011 Pearson Education, Inc. Percent literate

27
© 2011 Pearson Education, Inc. Formula for HDI

28
© 2011 Pearson Education, Inc. Formula for HDI

29
© 2011 Pearson Education, Inc. HAPPY WOMEN’S HISTORY MONTH

30
© 2011 Pearson Education, Inc. Why Does Development Vary by Gender? Gender Inequality Measures UN created the Gender Inequality Index (GII) that is based on multiple metrics. Empowerment Defined: Ability of women to achieve improvements in status. Percentage of seats held by women in the national legislature. Percentage of women who have completed high school. Labor Force Female labor force participation rate defined as percentage of women holding full-time jobs outside the home. Highest in developed countries. Reproductive Health Maternal mortality ratio Adolescent fertility rate
 that is based on multiple metrics. Empowerment Defined: Ability of women to achieve improvements in status. Percentage of seats held by women in the national legislature. Percentage of women who have completed high school. Labor Force Female labor force participation rate defined as percentage of women holding full-time jobs outside the home. Highest in developed countries. Reproductive Health Maternal mortality ratio Adolescent fertility rate.")
31
© 2011 Pearson Education, Inc. Gender Equality? https://youtu.be/Tq5 OQafDVxc

32
© 2011 Pearson Education, Inc. Let the Wild Rumpus of M ĀĀĀĀĀĀĀĀĀĀPS Begin!

33
© 2011 Pearson Education, Inc. Gender Inequality Index

34
© 2011 Pearson Education, Inc. Percent seats in legislature held by women

35
© 2011 Pearson Education, Inc. Ratio of female to male rates of secondary education

36
© 2011 Pearson Education, Inc. Ratio of female to male labor force participation

37
© 2011 Pearson Education, Inc. Deaths of women per 100,000 live births

38
© 2011 Pearson Education, Inc. Adolescent fertility rate per 1,000

39
© 2011 Pearson Education, Inc. Gender Inequality Index improvement

40
© 2011 Pearson Education, Inc. Why Does Development Vary by Gender? Gender Inequality Trends UN asserts gender inequality has declined in nearly every country since the 1990s. Greatest improvements in Southwest Asia and North Africa. U.S. is one of few developed countries where the GII has increased. Reproductive rights much lower in U.S. compared to other very high HDI countries. Percentage of women in the national legislature is relatively lower than other high HDI countries.

41
Progress Toward Development Figure 9-26

42
Why Do LDCs Face Obstacles to Development? Development through self-sufficiency Characteristics: Pace of development = modest Distribution of development = even Barriers are established to protect local business Three most common barriers = (1) tariffs, (2) quotas, and (3) restricting the number of importers Two major problems with this approach: Inefficient businesses are protected A large bureaucracy is developed
 tariffs, (2) quotas, and (3) restricting the number of importers Two major problems with this approach: Inefficient businesses are protected A large bureaucracy is developed.")
43
Paths to Development India’s Self-Sufficiency Model Jawaharlal Nehru: the first Prime Minister of independent India (1947–64) Nehru chose a path that focused on internal development without outside interference. Backlash to years of British control. It was based on isolation and a system of high tariffs and quotas. Discouraged exports and instead focused on producing for internal consumption.

44
Paths to Development India’s Self-Sufficiency Model Government controlled prices created monopolies and this led to inefficiency. A complex bureaucracy led to a reduction in entrepreneurship. Since the early 1980/90’s free market reforms have led to rapid increase in development.

45
Triumph of International Trade Approach Figure 9-27 Figure 9-28

46
Why Do LDCs Face Obstacles to Development? Development through international trade China’s Market Socialist model Rostow’s model of development Examples of international trade approach The “four Asian dragons” Petroleum-rich Arabian Peninsula states Three major problems: Uneven resource distribution Increased dependence on MDCs Market decline

47
International Trade Approach China’s Market Socialist model Central planned economy Gradual approach starting with Special Economic Zones Joint partnerships have led to direct foreign investment. Government backed, slow privatization

48
https://mediaplayer.pearsoncmg.com/assets/_embed.true/yfFWbZ1RGJmHyvCe_fvmuV5ZfKnx1ziX

49
Why Do LDCs Face Obstacles to Development? International trade approach triumphs The path most commonly selected by the end of the twentieth century Countries convert because evidence indicates that international trade is the more effective path toward development Example: India World Trade Organization Foreign direct investment

50
© 2011 Pearson Education, Inc. WORLD TRADE AS A PERCENTAGE OF INCOME Trade as a percentage of GDP increased rapidly in developing countries, beginning in the 1990s. The severe recession that began in 2008 caused a sharp decline in trade.

51
© 2011 Pearson Education, Inc. Why Do Countries Face Obstacles to Development? Financing Development Finance comes from two primary sources: 1.Direct investment by transnational corporations 2.Loans from banks and international organizations Foreign Direct Investment (FDI) Defined: Investment made by a foreign company in the economy of another country. FDI grew from $130 billion in 1990s to $1.5 trillion in 2000 and 2010. In 2010, only 2/5 went from developed to developing, the rest went developed to another developed country. Major source of FDI are transnational corporations
 Defined: Investment made by a foreign company in the economy of another country. FDI grew from $130 billion in 1990s to $1.5 trillion in 2000 and In 2010, only 2/5 went from developed to developing, the rest went developed to another developed country. Major source of FDI are transnational corporations.")
52
Foreign Direct Investment Figure 9-30

53
© 2011 Pearson Education, Inc. Why Do Countries Face Obstacles to Development? Financing Development Loans Two major lenders to developing countries: 1.World Bank Includes the International Bank for Reconstruction and Development (IBRD) and International Development Association (IDA). IBRD provides loans to countries to reform public administration and legal institutions, develop and strengthen financial institutions, and implement transportation and social service projects. IDA provides support to countries considered too risky to receive loans from IBRD.
 and International Development Association (IDA). IBRD provides loans to countries to reform public administration and legal institutions, develop and strengthen financial institutions, and implement transportation and social service projects. IDA provides support to countries considered too risky to receive loans from IBRD..")
54
© 2011 Pearson Education, Inc. Why Do Countries Face Obstacles to Development? Financing Development Loans Two major lenders to developing countries: 2.International Monetary Fund (IMF) IMF provides loans to countries experiencing balance-of- payments problems that threaten expansion of international trade. IMF assistance designed to help a country rebuild international reserves, stabilize currency exchange rates, and pay for imports without the imposition of harsh trade restrictions or capital controls that could hamper the growth of world trade.
 IMF provides loans to countries experiencing balance-of- payments problems that threaten expansion of international trade. IMF assistance designed to help a country rebuild international reserves, stabilize currency exchange rates, and pay for imports without the imposition of harsh trade restrictions or capital controls that could hamper the growth of world trade..")
55
© 2011 Pearson Education, Inc. Why Do Countries Face Obstacles to Development? Financing Challenges in Developing and Developed Countries Developing Countries IMF, World Bank, and developed countries fear that granting, canceling, or refinancing debts without strings attached will perpetuate bad habits in developing countries. Developing countries required to prepare a Policy Framework Paper outlining a structural adjust program, which includes economic goals, strategies for achieving the objectives, and external financing requirements.

56
© 2011 Pearson Education, Inc. Why Do Countries Face Obstacles to Development? Financing Challenges in Developing and Developed Countries Developed Countries Heart of the global economic crisis in developed countries was the poor condition of many banks and other financial institutions. Bad loans were especially widespread in housing, which led to the housing bubble- a rapid increase in the value of houses following by a sharp decline in their value. Bubble burst because of relaxation of long-standing restrictions on the ability of individuals to purchase houses and higher-income people took advantage of low-interest loans to buy additional houses.

57
Rostow - Stages of Growth The work of American Walt W. Rostow Rostow is an economic historian Countries can be placed in one of five categories in terms of its stage of growth: A child in Sierra Leone making breakfast. Which stage would a country like Sierra Leone fit in?

58
Rostow - Stages of Growth 1. Traditional Society Characterised by subsistence economy – output not traded or recorded existence of barter high levels of agriculture and labour intensive agriculture Village in Lesotho. 86% of the resident workforce in Lesotho is engaged in subsistence agriculture.

59
Rostow - Stages of Growth 2. Pre-conditions: Development of mining industries Increase in capital use in agriculture Necessity of external funding Some growth in savings and investment The use of some capital equipment can help increase productivity and generate small surpluses which can be traded.

60
Rostow - Stages of Growth 3. Take off: Increasing industrialisation Further growth in savings and investment Some regional growth Number employed in agriculture declines At this stage, industrial growth may be linked to primary industries. The level of technology required will be low.

61
Rostow - Stages of Growth 4. Drive to Maturity: Growth becomes self- sustaining – wealth generation enables further investment in value adding industry and development Industry more diversified Increase in levels of technology utilised As the economy matures, technology plays an increasing role in developing high value added products.

62
Rostow - Stages of Growth 5. High mass consumption High output levels Mass consumption of consumer durables High proportion of employment in service sector Service industry dominates the economy – banking, insurance, finance, marketing, entertainment, leisure and so on.

63
Criticisms: Too simplistic Necessity of a financial infrastructure to channel any savings that are made into investment Will such investment yield growth? Not necessarily Need for other infrastructure – human resources (education), roads, rail, communications networks Efficiency of use of investment – in palaces or productive activities? Rostow argued economies would learn from one another and reduce the time taken to develop – has this happened?
, roads, rail, communications networks Efficiency of use of investment – in palaces or productive activities. Rostow argued economies would learn from one another and reduce the time taken to develop – has this happened .")
64
© 2011 Pearson Education, Inc. What Is the WTO? The World Trade Organization (WTO) is the only global international organization dealing with the rules of trade between nations. WTO agreements are negotiated and signed by the trading nations and ratified in their parliaments. The goal is to help producers of goods and services, exporters, and importers conduct and grow their business.
 is the only global international organization dealing with the rules of trade between nations. WTO agreements are negotiated and signed by the trading nations and ratified in their parliaments. The goal is to help producers of goods and services, exporters, and importers conduct and grow their business..")
65
© 2011 Pearson Education, Inc. The Goal To improve the welfare of the peoples of the member countries.

66
© 2011 Pearson Education, Inc. Past, Present, Future The WTO came into being in 1995. The WTO is the successor to the General Agreement on Tariffs and Trade (GATT), established in the wake of the Second World War.
, established in the wake of the Second World War..")
67
© 2011 Pearson Education, Inc. The Past 50 Years: Exceptional Growth in World Trade Merchandise exports grew on average 6% annually Total trade in 1997 was 14 times the level of 1950 In 1997, 40 governments concluded negotiations for tariff free trade.

68
© 2011 Pearson Education, Inc. The Organization Chart

69
The Quad Some of the most difficult negotiations have needed an initial breakthrough in talks among the four largest members United States Canada European union Japan

70
© 2011 Pearson Education, Inc. Criticisms of the WTO The WTO undermines state sovereignty It undermines representative democracy Member nations are prevented from protecting the environment Members are unable to uphold laws guaranteeing workers’ rights The WTO is controlled by the larger nations The WTO represents the interests of large corporations and wealthy citizens

71
© 2011 Pearson Education, Inc. Some protesters have arguments fully worthy of consideration. They deserve a better venue for hearing than the streets. Nihilistic anarchists usually capture the legal protest, along with, lugubrious labor Luddites, trade terrorists, and… …the clueless

72
Why Do LDCs Face Obstacles to Development? Fair trade approach Products are made and traded in a way that protects workers and small businesses in LDCs Two sets of standards Fair trade producer standards Fair trade worker standards Producers and workers usually earn more Consumers usually pay much higher prices

73
Core? Periphery?

74
Core and Periphery Model Polar Projection

75
The Emergence of the World System The world system is the result of the increasing interdependence of cultures and ecosystems that were once relatively isolated by distance and boundaries. Of particular significance to the development of the world system was the European Age of Discovery, wherein the European sphere of influence began to be exported far beyond its physical boundaries by means of conquest and trade.

76
Influence of the Capitalist World Economy The defining attribute of capitalism is economic orientation to the world market for profit. Colonial plantation systems led to monocrop production in areas that once had diverse subsistence bases (beginning in the seventeenth century)…PLANTATIONS. Colonial commodities production was oriented toward the European market.
…PLANTATIONS. Colonial commodities production was oriented toward the European market..")
77
Immanuel Wallerstein Born September 28, 1930 in New York City, is an American sociologist, historical social scientist, and world-systems analyst. His bimonthly commentaries on world affairs are syndicated. Wallerstein first became interested in world affairs as a teenager in New York City, and was particularly interested in the anti-colonial movement in India at the time.

78
Wallerstein’s World System Theory Wallerstein has argued that international trade has led to the creation of a capitalist world economy in which a social system based on wealth and power differentials extends beyond individual states. The world system is arranged according to influence: core (most dominant), to semi-periphery, to periphery (least dominant). The core consists of the strongest and most powerful nations in which technologically advanced, capital-intensive products are produced and exported to the semi-periphery and the periphery. The semi-periphery consists of industrialized “Third World” nations that lack the power and economic dominance of the core nations (Brazil is a semi-periphery nation). The periphery consists of nations whose economic activities are less mechanized and are primarily concerned with exporting raw materials and agricultural goods to the core and semi-periphery.
, to semi-periphery, to periphery (least dominant). The core consists of the strongest and most powerful nations in which technologically advanced, capital-intensive products are produced and exported to the semi-periphery and the periphery. The semi-periphery consists of industrialized Third World nations that lack the power and economic dominance of the core nations (Brazil is a semi-periphery nation). The periphery consists of nations whose economic activities are less mechanized and are primarily concerned with exporting raw materials and agricultural goods to the core and semi-periphery..")
79
Wallerstein’s World Systems Questions FRONT ROW: What was the New European Division of Labor that emerged in the late 15 th and early 16 th century. SECOND ROW: What was the historical relationship between the Core and the Periphery? THIRD ROW: How are some regions considered “Semi-Periphery” by Wallerstein and what role did they play? FOURTH/FIFTH ROW: What are some specific regions that are still affected by the concepts in the World Systems Theory? How?

80
World Systems theory Dependency theory is a body of social science theories predicated on the notion that resources flow from a "periphery" of poor and underdeveloped states to a "core" of wealthy states, enriching the latter at the expense of the former. It is a central contention of dependency theory that poor states are impoverished and rich ones enriched by the way poor states are integrated into the "world system." Dependency theorists like Andre Gunder Frank, were criticised by later Marxists because it only describes the relationship between the core and periphery as a two tier model and doesn’t explain fully. Wallerstein refined Frank’s dependency theory in his World Systems Theory

81
Four aspects of Wallerstein’s World Systems Theory 1. Developing countries are not exploited by individual countries but by the whole capitalist, profit-seeking system in a Modern World System. The MWS is a unified system of capitalism

82
2. Three zones in the MWS i. The core/developed nations – these control world trade and monopolize manufactured goods ii. The semi-peripheral zone e.g. Brazil, South Africa, India, have urban areas like the core but large areas of rural poverty like the periphery iii. The peripheral countries e.g.. Most of Africa – they provide primary products for both the semi periphery and the core

83
3 Wallerstein’s model is dynamic (This allows for movement and change). Countries are ‘socially mobile’ they can move in from the periphery into the semi periphery (ex. Asian tigers) or out from the core to the semi periphery (Russia, sometimes...)
 or out from the core to the semi periphery (Russia, sometimes...).")
84
4 While Wallerstein refines Frank’ theory there are still similarities Both show how surplus value created in the periphery is appropriated by the semi periphery and especially the core Both see the origins of exploitation of some countries by others to have originated in slavery, colonialism and neo-colonialism

85
Modern World System of capitalism is profit seeking The pursuit of profit by capitalism results in exploitation between classes Commodification – everything is turned into a commodity to be bought and sold

86
Wallerstein’s World Systems Questions FOURTH ROW: What was 1 aspect of Wallerstein’s Stages 1 and 2 of Growth that would help a state grow? What was 1 aspect of Wallerstein’s Stages 3 and 4 of Growth that would help a state grow?

87
De-skilling of labor Proletarianization occurs (ie. The nature of call centers?) Wallerstein argues that this process also occurs between nations Modern World System of capitalism is profit seeking Karl Marx
 Wallerstein argues that this process also occurs between nations Modern World System of capitalism is profit seeking Karl Marx.")
88
Evaluation of World Systems Theory Weaknesses I. Both Frank and Wallerstein are economically deterministic II. Wallerstein does not say how capitalism can be overcome as Marx said it would

89
Evaluation of World Systems Theory Weaknesses III. Wallerstein does not look at internal factors (ie. mismanagement and corruption in the LDC’s) IV. Methodology is too vague and unscientific, ‘core’ etc cannot be clearly operational zed
 IV. Methodology is too vague and unscientific, ‘core’ etc cannot be clearly operational zed.")
90
Evaluation of World Systems Theory Strengths 1Wallerstein was one of the first to recognise ‘globalisation’ of the world and the international division of labour as the basis of global inequality

91
Evaluation of World Systems Theory Strengths 2 Globalisation theorists also show how dependency is not a one way process, there is inter-dependency between the developing and western world. (E.g. economic crisis caused by debt can ripple out and affect core nations – unemployment and destabilisation of western currencies)
.")
92
HDI DAY Look over the Human Development Index and its components list from NorwAy to (Not Norway) hand out. Pick ONE country from each of the FOUR levels (VERY HIGH HUMAN DEVELOPMENT, HIGH, MEDIUM, LOW). Go to www.cia.gov and click on the World Factbook link in the middle under “Library/Publications”. You will do your research on the CIA website for this project.www.cia.gov For each of the states you have chosen you will go to that country’s page and click on and read through the PEOPLE and the ECONOMICS sections. From that for each country you will give a brief 5-8 sentence explanation how the country is in their particular level of development based on your research in the PEOPLE and the ECONOMICS sections. Quote particular statistics and facts from the CIA World Factbook to make your points. Use specific human geography terms and vocabulary where applicable. This should be 1-2 pages typed. It can be saved in your student home folder or printed out and handed in to the classroom folder. DUE DATE: FRIDAY 3/13/15
. Go to and click on the World Factbook link in the middle under Library/Publications . You will do your research on the CIA website for this project. For each of the states you have chosen you will go to that country’s page and click on and read through the PEOPLE and the ECONOMICS sections. From that for each country you will give a brief 5-8 sentence explanation how the country is in their particular level of development based on your research in the PEOPLE and the ECONOMICS sections. Quote particular statistics and facts from the CIA World Factbook to make your points. Use specific human geography terms and vocabulary where applicable. This should be 1-2 pages typed. It can be saved in your student home folder or printed out and handed in to the classroom folder. DUE DATE: FRIDAY 3/13/15.")
93
Why is Energy Important for Development? Energy Demand and Supply Supply is the quantity of something that producers have available for sale. Demand is the quantity that consumers are willing and able to buy. 5/6 of the world’s energy needs are supplied by fossil fuels, which is an energy source formed from the residue of plants and animals buried millions of years ago. Coal (27.9%) Petroleum (33.2%) Natural Gas (22.1%)
 Petroleum (33.2%) Natural Gas (22.1%).")
94
Why is Energy Important for Development? Energy Demand and Supply Demand For Energy Although fewer in number, developed countries consume about ½ of the world’s energy. Percent of World Energy Consumed China: 20.4% U.S.: 18.3% Europe: 15.1% Per capita consumption of energy is greatest in North America. Contains 1/20 of world’s population and consumes ¼ of the world’s energy. Per capita consumption of energy is nearly three times greater in developed countries than in developing countries.

95
ENERGY DEMAND PER CAPITA The highest per capita consumption is in North America, and the lowest is in sub-Saharan Africa.

96
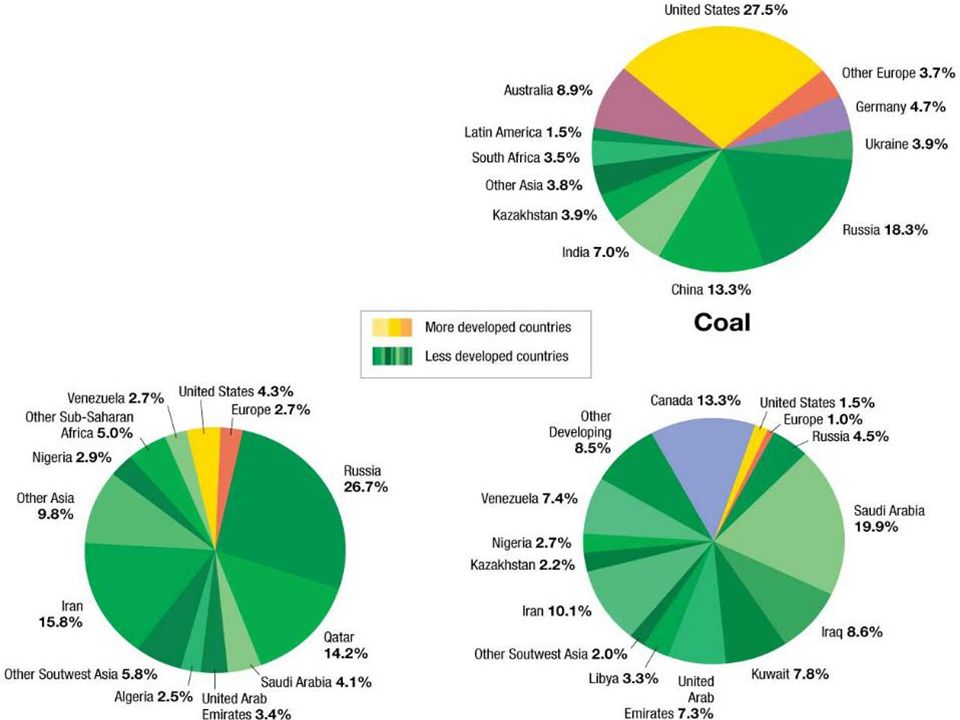
Why is Energy Important for Development? Energy Demand and Supply Energy Supply Earth’s energy resources are not distributed evenly. Global Coal Distribution Today’s main reserves of coal are located in the mid-latitude countries. China and the U.S. supply nearly 1/2 and ¼, respectively, of the world’s coal. Global Petroleum Distribution Today’s main reserves are located on the seafloor and in areas once under water millions of years ago. Russia and Saudi Arabia together supply ¼ of the world’s petroleum supply. U.S. supplies ¼ of the global supply Remaining ½ of world supply of petroleum is supplied by developing countries (primarily in S.W. and Central Asia)
.")
97
COAL PRODUCTION China is the world’s leading producer of coal, followed by the United states.

98
PETROLEUM PRODUCTION Russia, Saudi Arabia, and the United States are the leading producers of petroleum.

99
Why is Energy Important for Development? Energy Demand and Supply Energy Supply Global Natural Gas Distribution 1/3 of natural gas production is supplied by Russia and S.W. Asia 1/3 by developing regions 1/3 by developed countries (primarily the U.S.)
.")
100
NATURAL GAS PRODUCTION The United States and Russia are the leading producers of natural gas.

101
Why is Energy Important for Development? Energy Demand and Supply Energy Reserves Two types of energy reserves exist. 1.Proven Reserves Defined: A supply of energy remaining in deposits that have been discovered. 2.Potential Reserves Defined: A supply of energy that is undiscovered but thought to exist. Proven Reserves Remaining supply of fossil fuels at current demand Coal: 131 years Natural Gas: 49 years Petroleum: 43 years

103
Why is Energy Important for Development? Energy Demand and Supply Energy Reserves Potential Reserves Potential reserves can be reclassified as a proven reserve. Undiscovered Fields: Newly discovered reserves are generally smaller and more remote, because the largest, most accessible fossil fuels deposits have already been exploited. Enhanced Recovery From Already Discovered Fields: Techniques used to remove the last supplies from a proven field. Unconventional Sources: Methods currently used to extract resources won’t work because of insufficient technology, environmentally unsound, or not economically feasible.

104
PETROLEUM PRODUCTION OUTLOOK The International Energy Agency forecasts that potential reserves will be converted to proven reserves through discovery and development of new fields at about the same rate as already proven reserves are depleted.

105
Why is Energy Important for Development? Energy Demand and Supply Controlling Petroleum Reserves Organization of the Petroleum Exporting Countries (OPEC) formed in 1960 to gain more control over their resource, as a result of U.S. and European transnational companies exploring and exploiting the oil fields of developing countries. Members Southwest Asia and North Africa Algeria, Iraq, Kuwait, Libya, Qatar, Saudi Arabia, and United Arab Emirates Other Regions Angola, Ecuador, Iran, Nigeria, and Venezuela Under OPEC, prices set by governments possessing the oil reserves rather than by petroleum companies.
 formed in 1960 to gain more control over their resource, as a result of U.S. and European transnational companies exploring and exploiting the oil fields of developing countries. Members Southwest Asia and North Africa Algeria, Iraq, Kuwait, Libya, Qatar, Saudi Arabia, and United Arab Emirates Other Regions Angola, Ecuador, Iran, Nigeria, and Venezuela Under OPEC, prices set by governments possessing the oil reserves rather than by petroleum companies..")
106
U.S. PETROLEUM CONSUMPTION, PRODUCTION, AND IMPORTS

107
Why is Energy Important for Development? Energy Demand and Supply Changing U.S. Petroleum Sources Beginning in 1950s, extracting domestic petroleum became more expensive than importing it from S.W. and Central Asia. U.S. imports increased from 14% (1954) to 58% (2009) of total consumption Sharp price increases of oil set by OPEC countries during 1970s and 1980s contributed to U.S. decreasing its reliance on OPEC oil by ½. Share of imports from OPEC countries declined from 2/3 in 1970s to 1/3 in 1980s. Price (adjusted for inflation ) of petroleum plummeted to lowest level, during the 1990s. Petroleum consumption significantly increased
 to 58% (2009) of total consumption Sharp price increases of oil set by OPEC countries during 1970s and 1980s contributed to U.S. decreasing its reliance on OPEC oil by ½. Share of imports from OPEC countries declined from 2/3 in 1970s to 1/3 in 1980s. Price (adjusted for inflation ) of petroleum plummeted to lowest level, during the 1990s. Petroleum consumption significantly increased.")
108
Why is Energy Important for Development? Alternative Energy Sources Nuclear Energy Electricity produced by splitting uranium atoms in a controlled environment via a process called fission. One product of nuclear reactions is radioactive waste. Nuclear Energy Distribution Supplies 14% of world’s electricity Used by only 30 of world’s nearly 200 countries 19 developed countries; 11 developing countries 2/3 of world’s nuclear power generated in North America and Europe Most highly dependent countries clustered in Europe Relatively higher concentration of nuclear power plants in the Eastern half of the U.S.

109
ELECTRICITY FROM NUCLEAR POWER Nuclear power is used in 37 countries, primarily in Europe and North America.

111
Why is Energy Important for Development? Alternative Energy Sources Nuclear Energy Challenges Radioactive waste is highly lethal to humans. Not possible to burn or chemically treat such waste to make it safe for human exposure. Waste must remain isolated from human contact for thousands of years, until it loses radioactivity. Uranium is a nonrenewable resource Proven reserves projected to last 124 years at current consumption rate. High Cost Nuclear power plants cost several billion dollars to build. Complexities of safe transportation and storage of radioactive waste are costly.

112
Why is Energy Important for Development? Alternative Energy Sources Renewable Energy Hydroelectric Power Harnesses the power of moving water to convert it to electricity. Leading source of renewable energy in both developed and developing regions. 2 nd most popular source of electricity after coal Lack of remaining acceptable sites to construct a hydroelectric dam poses a challenge to increasing reliance in U.S. Biomass Biomass energy sources include wood and crops that can be burned as fuel to generate electricity and heat. Ex.: Sugarcane, corn, and soybeans can be processed into motor- vehicle fuels.

113
Why is Energy Important for Development? Alternative Energy Sources Renewable Energy Limiting Factors for Increasing Reliance on Biomass Inefficiency Burning biomass may require as much energy to produce the crops as they supply. “Putting Food” in the Gas Tank Biomass already serves essential purposes, such as providing much of Earth’s food, clothing, and shelter. Environmental Concerns Logging trees for wood to be burned may reduce the fertility of the forest.

114
Why is Energy Important for Development? Alternative Energy Sources Renewable Energy Wind Energy Relatively minimal impact on the environment Greater potential for increased use, because only a small portion of the potential resource has been harnessed. Greatest challenge for expanding reliance is opposition by environmentalists who voice their concerns about windmills being noisy, lethal for birds and bats, and a visual blight on the landscape.

115
WIND POWER Winds are especially strong enough to support generation of power in the U.S. Plains states.

116
Why is Energy Important for Development? Alternative Energy Sources Renewable Energy Solar Energy Ultimate renewable resource supplied by the Sun. U.S. receives 1% of its electricity from solar, but potential growth is limitless. Solar energy is harness through one of two means. 1.Passive solar energy systems capture energy without using special devices. 2.Active solar energy systems collect solar energy and convert it either to heat energy or to electricity either directly or indirectly.

117
SOLAR PANELS Solar panels installed on apartment rooftops in the Old City of Jerusalem are used to heat water, which is stored in the adjacent tanks. The domes are the Church of the Holy Sepulchre, built at the site where Jesus is thought to have been crucified, buried, and resurrected (see Chapter 6).
..")
118
Solar panels are generating electricity for this family’s house in Rumbek, South Sudan.

Similar presentations


 Measure of the total value of the officially recorded.>")


