Download presentation
Presentation is loading. Please wait.

1
The demographic development of the Swedish-speaking population of Finland Fjalar Finnäs Åbo Akademi University www.vasa.abo.fi/users/ffinnas/Demographic development2.ppt

2
Tandefelt and Finnäs (2007). Language and demography: historical development International Journal of the Sociology of Language 187/188 pp. 35-54 http://www.folktinget.fi/pdf/publikationer/finlanssv2005.pdf

3
Population statistics in Finland Population and vital statistics since 1749 (Sweden) Language included since 1880 Every citizen have a unique language (mother tongue) in the population register No information about knowledge in other language(s).
 Language included since 1880 Every citizen have a unique language (mother tongue) in the population register No information about knowledge in other language(s).")
4
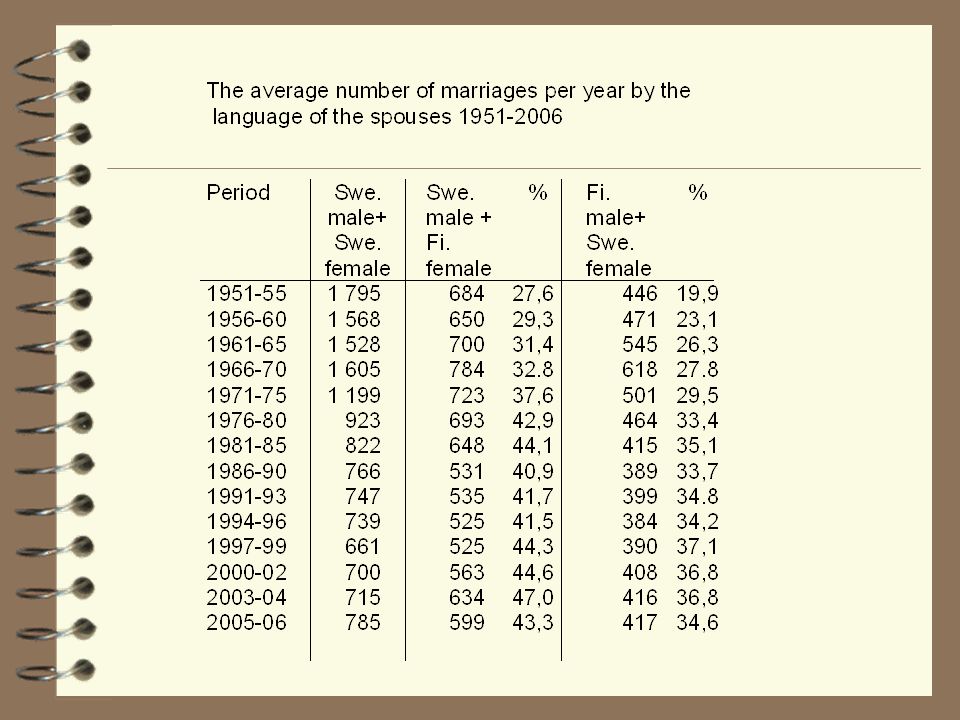
Bilingual marriage - spouses have different languages No explicit information about language use Children are registered by language at birth (=when included in the population register) Information mainly for administrative/planning purposes - no explicit consequences for the individual
 Information mainly for administrative/planning purposes - no explicit consequences for the individual")
5
Language status of municipalities Bilingual if the minority excees 3000 persons or 8 per cent. Bilingual – obliged to give services in both languages

7
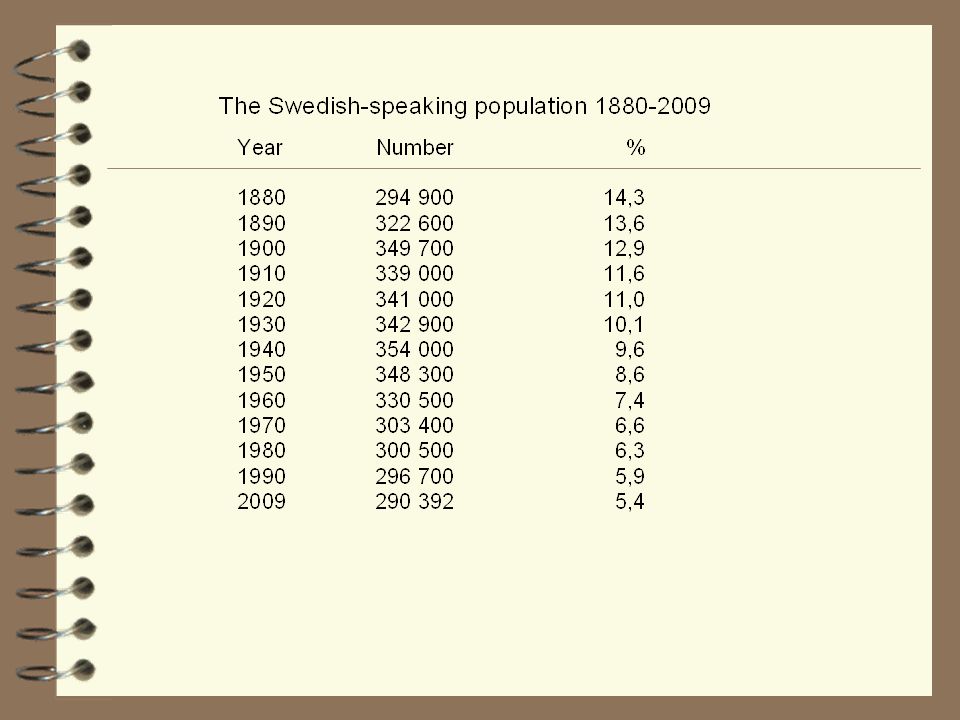
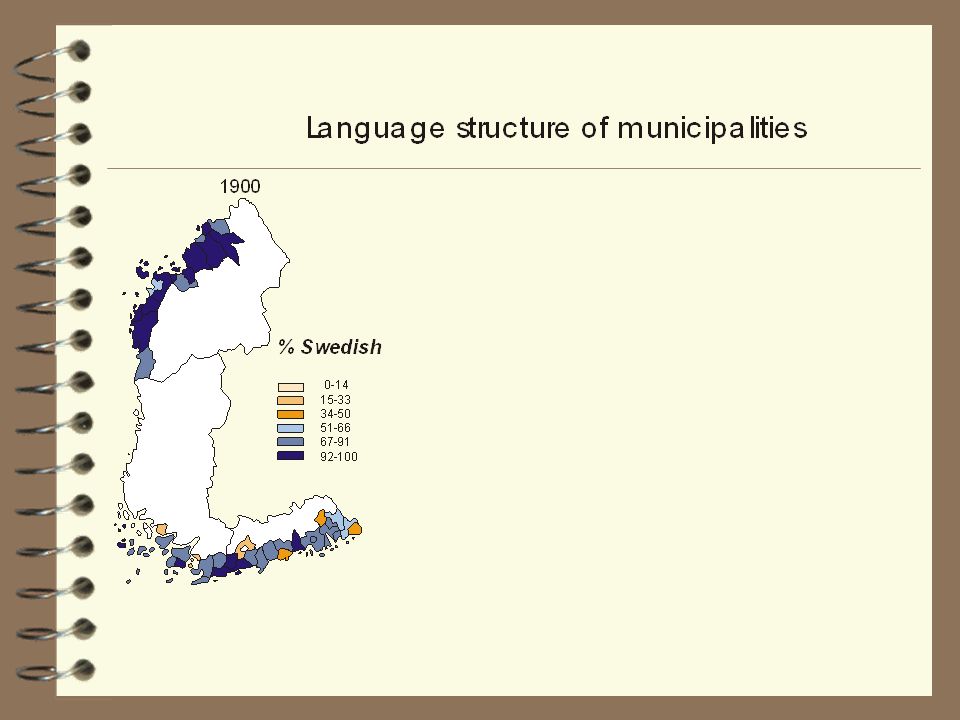
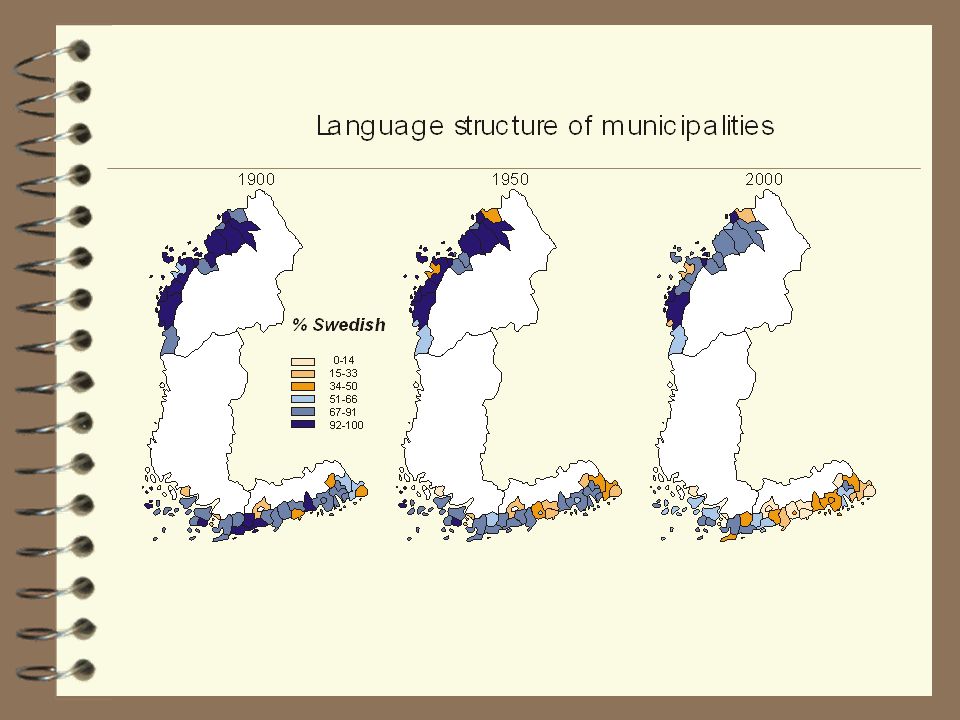
The distribution by language status of the municipality of residence 1880-2009

8
1950 1970 1980 2009 MunPopul.Mun.Popul. Mun Popul.Mun.Popul. Swedish 4792 8223162 7002659 3631939 698 Bilingual 67-90 % 2385 9821751 7001455 712969 435 50-66 % 933 160850 000430 968427 181 34-49 % 427 847723 700834 108521 900 3-33 % 893 786111062001310894313117 866 Total 91333597742943516528909450276 080 Finnish 14 6899 05511 38813 312 Finland 348286303406300482290 392 Municipalities by language structure and number of Swedish- speakers 1950-200

12
Age structure of the Swedish-speaking population 1950 and 1970 1950 04812160481216 Females Males 1000-tal 1970 04812160481216 1000-tal

17
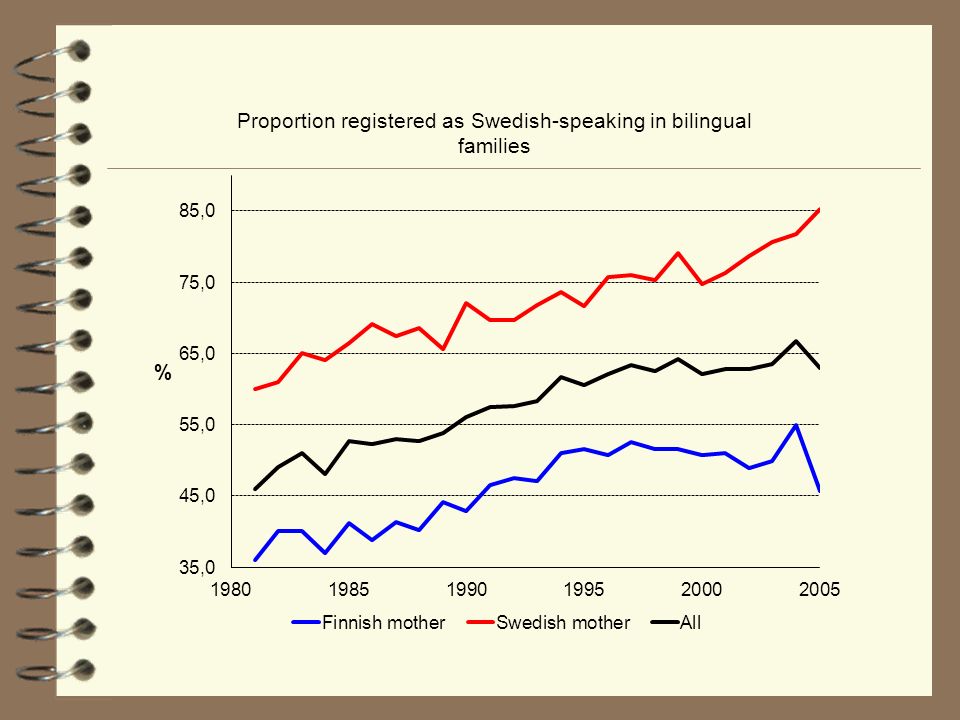
The proportion Swedish registered children in bilingual families and their proportion of all Swedish children 1970 and 2005

18
Number of new pupils in Swedish schools and the corresponding number of Swedish registered children aged 7 years.

20
Estimated relative divorce rate based on main effects model Language FinnishBilingualSwedish 1.01.100.57 Account is taken for place of residence, degree of urbanisation, age of female, age difference, educational level of both spouses and year of birth

21
Difference in life expectancy Males 2.5 – 3 years Females ~ 1 year Age standardized death rates by language group

23
Age distribution 2005

24
Population forcasts

25
Number of pupils and estimated number of students

26
Level of education in different age groups ABCDE 20-2412,880,02,54,00,7 25-2910,649,217,010,312,9 30-3414,438,921,87,917,0 35-3916,839,819,96,916,6 40-4421,538,618,38,413,1 45-4925,935,916,312,29,6 50-5436,529,615,810,17,9 55-5942,624,315,39,97,9 60-6451,221,212,58,46,8 65-6960,018,610,06,74,8 70-7465,816,38,55,44,0 75+72,613,46,64,03,4 A : Comprehensive school.... E: University degree

27
Swedish and Finnish speaking persons aged 35-39 years by level of education in different regions 2001 Swedish-speakersFinnish-speakers AB C D E A B C D E Finland 16,8 39,8 19,9 6,9 16,6 14,8 47,0 21,8 5,7 10,7 N yland 15,9 32,9 20,0 7,0 24,1 16,0 38,1 23,0 6,4 16,5 Eastern N 21,1 39,1 22,6 6,1 11,1 18,4 44,5 22,4 5,0 9,7 Åboland 12,1 41,4 16,8 8,1 21,6 15,2 47,2 21,2 5,7 10,7 Österb. 15,0 46,3 20,0 7,5 11,2 17,0 48,3 21,8 5,1 7,8 Åland 24,9 44,0 19,4 4,6 7,0 17,5 35,0 33,3 5,0 9,2

28
The distribution by industry of the economically population in 1970, 1980 and 1995 for Finnish-speakers and Swedish-speakers. Whole country. Finnish-speakers 197020,334,715,36,93,318,11,4 198012,734,314,07,95,425,30,3 19956,926,914,47,311,131,12,3 Swedish-speakers 197019,429,317,69,94,518,01,3 198014,927,115,910,76,524,40,4 19959,120,915,410,110,531,32,8 Agri- Manu- Trade Trans- Finan- Service Unknown culture factory port cing

29
The distribution by industry of the economically population in 1970, 1980 and 1995 for Finnish-speakers and Swedish-speakers. Bilingual regions. Finnish-speakers 19701,736,920,57,87,224,61,3 19801,330,118,79,310,529,70,5 19950,721,117,88,516,733,12,0 Swedish-speakers 197019,728,817,79,94,618,01,3 198014,326,716,211,06,724,40,4 19959,220,615,310,210,531,32,8 Agri- Manu- Trade Trans- Finan- Service Unknown culture factory port cing

30
The distribution by socioeconomic position of the economically active population in Finland 1995 for Finnish-speakers and Swedish-speakers. Finland 1995 Civil servants FarmersEmplo- yers Upper level Lower level Blue- collar OtherTotal Finnish-sp.4,58,718,134,632,71,4100 Swedish-sp.6,79,421,235,025,42,2100 Swedish and bilingual municipalities 1970 and 1995 Finnish-speakers 19701,14,510,934,948,20,4100 19950,46,125,139,128,40,9100 Swedish-speakers 197017,76,310,830,933,80,5100 19957,29,320,634,925,82,2100

31
Civil servants FarmersEmplo -yers Upper level Lower level Blue- collar OtherTotal Metropolitan Fin.0,15,728,140,524,70,9100 Swe.0,57,135,640,515,01,4100 Nyland rural Fin2,58,517,235,435,31,2100 Swe9,010,615,833,528,72,3100 Österbotten rural Fin10,38,810,329,438,72,5100 Swe20,611,49,924,929,73,5100 The distribution by socioeconomic position of the economically active population in Finland 1995 for Finnish-speakers and Swedish-speakers in certain regions..

Similar presentations


 1 DEMOGRAPHY: Population Pyramids December 8, 2014.>")


 Betty C. Jung, RN, MPH, CHES.>")


