Download presentation
Presentation is loading. Please wait.

1
Precision Ag in Cotton Clint Sharp

2
Use NDVI to Map “Vigor Zones” We map Vigor Zones, not yield zones. –Can be done with Aircraft or GreenSeeker –Vigor Map is what you use to write VR Nitrogen Mission Plans Vigor Zones are stable over time –Amount of vigor expressed will change from year to year, but the location relationship does not. Yield Zones are not stable over time

3
Basic Concept: Manage cotton vigor zones to minimize cost and maximize yield. Low Vigor Zone –Reduce inputs and increase vigor greatly Medium Vigor Zone –Reduce inputs and increase vigor carefully High Vigor Zone –Reduce Nitrogen, decrease vigor greatly and apply intensive insect control

4
In General We use a single shot taken at the latter part of the growing season. This has to be taken while the cotton is in conventional production. With this specific shot, we make all future years vigor zone maps. Field Scouting is done to determine the specific recommendation for application per zone.

5
Image Data Analysis The “base management image” is year 2001 2002, 2003, and 2004 VR Crop Years Crop input recommendations were based on “2001” Image Data

6
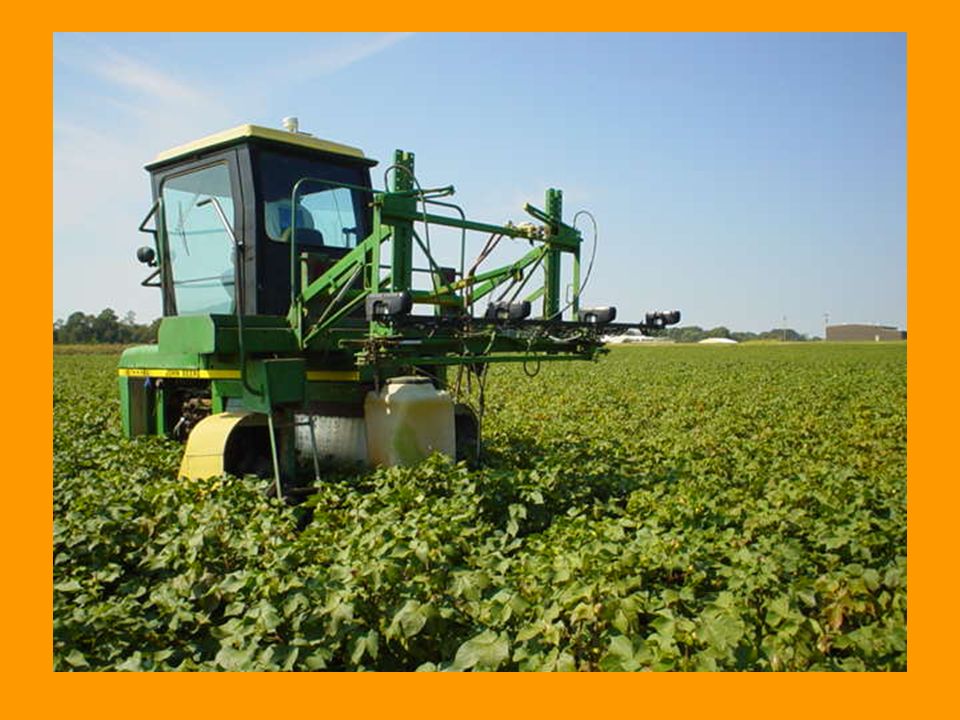
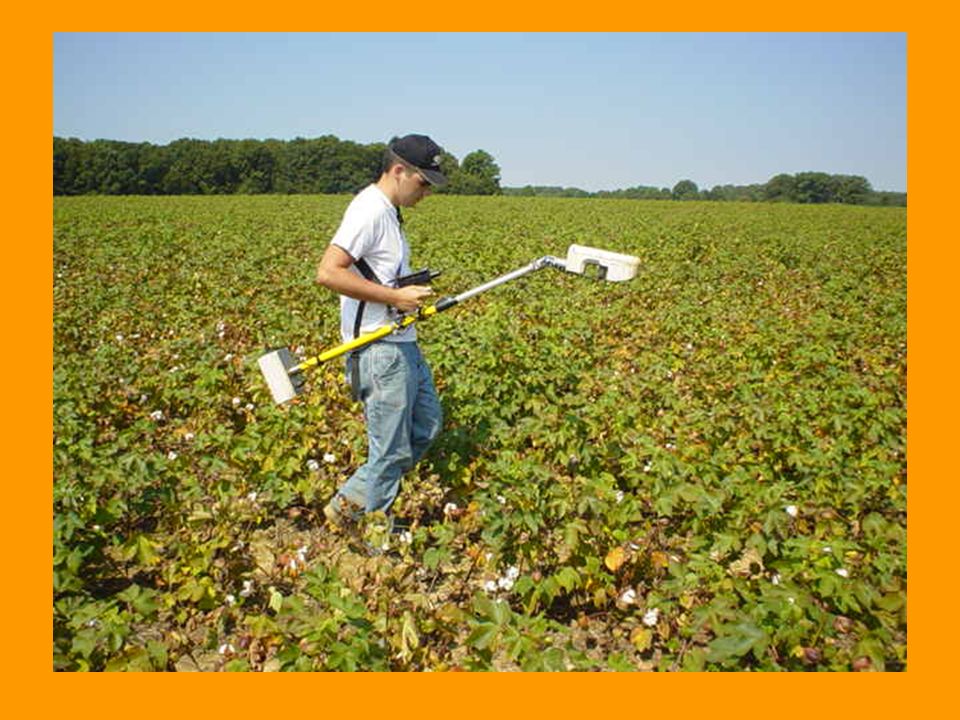
Data Collected On a weekly basis the following data was collected. –GreenSeeker ® NDVI –Cotton Height –Total Nodes –Elongation of the 4 th internode –Standard COTMAN © data set End of season –Total final plant maps –Aircraft platform multispectral imagery –Crop Yield

7
Key Study Design 4 Paired farm fields (8 Fields Total) –One field variable rate managed Three zone VR management missions –One field conventionally managed Managed on standard university recommendations.
 –One field variable rate managed Three zone VR management missions –One field conventionally managed Managed on standard university recommendations.")
8
Farm Locations Research Farms Sommerville, TN Fayette County Karcher Farms

9
Example Lay-out Variable Rate Field Conventional Rate Field

10
Example: Zone Classing Multispectral Image 08/06/2001 Classed image used for All activities in 2002 Low Medium High

11
Management Light is 2/ft rate Medium 3/ft rate Dark 4/ft rate Variable Applied Seeding In-furrow Fungicide In-furrow Insecticide Nitrogen Plant Growth Regulator In-season Insecticides Crop Termination VR Seeds Per Foot

12
Variable Rate Nitrogen Plan Variable Rate Pix Plan No Spray Spray Low Spray High L = 50 M = 90 MH = 70 H = 60

13
2001 CV 2002 VR2003 VR 2002 CV2003 CV NDVI Data for Three Years

14
Low Zone Medium Zone High Zone Zone Characteristics Low zone Fewest Nodes Fewest Bolls per node Medium Zone Medium in Node Production Highest in first position bolls on nodes 6, 7, 8 and 9 High Zone Most total nodes Most nodes with bolls

15
New Technology in 2001

18
Need to Define Standard: “End of Season ” Zone Characteristics Low Vigor ZoneMedium Vigor ZoneHigh Vigor Zone Cotton up to 34 inches tallCotton 34 to 42 inches tallCotton greater than 42 inches tall Less than 15 total nodes15 to 18 total nodesGreater than 18 total nodes Less than 5 bolls per plantGreater than 5 bolls per plant Season long expression of elongation of the 4 th internode of 1.5 to 2 inches Season long expression of elongation of the 4 th internode of 2 to 2.5 inches Season long expression of elongation of the 4 th internode of greater than 2.5 inches ? NDVI to NDVI

19
NDVI Too High 2001

20
High Zone Syndrome (HZS) HZS is a problem associated with the most productive area in cotton producing fields. Yield in the High Vigor Zone is highly variable from year to year.

21
VR +128 VR Low Zone VR +206 VR +655 Medium Zone High Zone VR CV

22
NDVI Map Wildy 07wYield Map Wildy 07w Low Yield High NDVI Real World Example

23
Yield Contributors The weather will control the yield expression of the zones. As we see better growing conditions, then the yield of the low and medium zones will increase. But the yield in the high vigor zone will go down. In hot dry conditions the opposite will happen.

24
VR to CV 2003-2004

Similar presentations


 Pam Turner Oklahoma State University.>")


 Nielsen Professor of Agronomy Purdue University West Lafayette, IN 47907-1150 Web:>")


