Download presentation
Presentation is loading. Please wait.

1
On the Verification of Particulate Matter Simulated by the NOAA-EPA Air Quality Forecast System Ho-Chun Huang 1, Pius Lee 1, Binbin Zhou 1, Jian Zeng 6, Marina Tsidulko 1, You-Hua Tang 1, Jeff McQueen 3, Qiang Zhao 7, Shobha Kondragunta 2, Rohit Mathur 4, Jon Pleim 4, George Pouliot 4, Geoff DiMego 3, Ken Schere 4, and Paula Davidson 5 1 Scientific Applications International Corporation, Camp Springs, Maryland. 2 NOAA/NESDIS Center for Satellite Applications and Research, Camp Springs, Maryland. 3 National Centers for Environmental Prediction, Camp Springs, Maryland. 4 National Oceanic and Atmospheric Administration, Research Triangle Park, NC. (On assignment to the National Exposure Research Laboratory, US EPA) 5 Office of Science and Technology, National Weather Service, Silver Spring, MD. 6 Earth Resources Technology Inc., Annapolis Junction, MD. 7 I.M. Systems Group, Inc., Rockville, MD.
 5 Office of Science and Technology, National Weather Service, Silver Spring, MD. 6 Earth Resources Technology Inc., Annapolis Junction, MD. 7 I.M. Systems Group, Inc., Rockville, MD..")
2
Outline NOAA-EPA Air Quality Forecast System GOES and AQF atmospheric optical depth (AOD) NCEP verification results Summary
 NCEP verification results Summary")
3
Air Quality Forecast System CONUS (ozone) became operational model on September 18, 2007 Developmental model; operational * + PM Chemistry CMAQ v4.5 driven by the WRF/NMM at 12 km NEI (2001), BEIS3, Mobile 6 AERO3: Aerosol Module with SOA (no sea salt) Updated ISORROPIA for numerical stability at low relative humidity Euler Backward Iterative (EBI) Solver for CB4 Minimum Kz to mimic urban island
 became operational model on September 18, 2007 Developmental model; operational * + PM Chemistry CMAQ v4.5 driven by the WRF/NMM at 12 km NEI (2001), BEIS3, Mobile 6 AERO3: Aerosol Module with SOA (no sea salt) Updated ISORROPIA for numerical stability at low relative humidity Euler Backward Iterative (EBI) Solver for CB4 Minimum Kz to mimic urban island")
4
AOD Comparisons In-site measurement (AERONET, AIRS) (Marina Tsidulko) Satellite measurement – GOES product comparisons with AERONET and MODIS (Prados et al, 2007) –(AERO) good for AOD > 0.15, Negative bias for AOD > 0.35 –(MODIS) good agreement and correlation of high AOD CMAQ AOD comparison with IMPROVE, MODIS, and AERONET in the eastern US (Roy et al, 2007) –good spatial and temporal patterns –CMAQ AOD is often less than MODIS AOD for the same concentration
 (Marina Tsidulko) Satellite measurement – GOES product comparisons with AERONET and MODIS (Prados et al, 2007) –(AERO) good for AOD > 0.15, Negative bias for AOD > 0.35 –(MODIS) good agreement and correlation of high AOD CMAQ AOD comparison with IMPROVE, MODIS, and AERONET in the eastern US (Roy et al, 2007) –good spatial and temporal patterns –CMAQ AOD is often less than MODIS AOD for the same concentration")
5
The NCEP/EMC Real-time * AOD Verification AQF AOD: The column integration of extinction ( σ) due to particulate scattering and absorption and layer thicknesses ( ΔZ i ) AQF AOD vs. GOES AOD Frequency: Daily (April to September 2007) Data: hourly from 1215 – 2115 UTC Domains: CONUS, East US, and West US
 Data: hourly from 1215 – 2115 UTC Domains: CONUS, East US, and West US.")
6
Visible Infrared The GOES Derived AOD (Prados et al, 2007)
")
7
AQF modeling and verification domains

8
mean over the period Total : 66.6% Cloud : 41.8% White Noise : 24.8% Null GOES AOD

9
mean over the period Total: 55.0% Cloud: 46.4% White Noise: 8.6% mean over the period Total: 78.3% Cloud: 34.8% White Noise: 43.5%

10
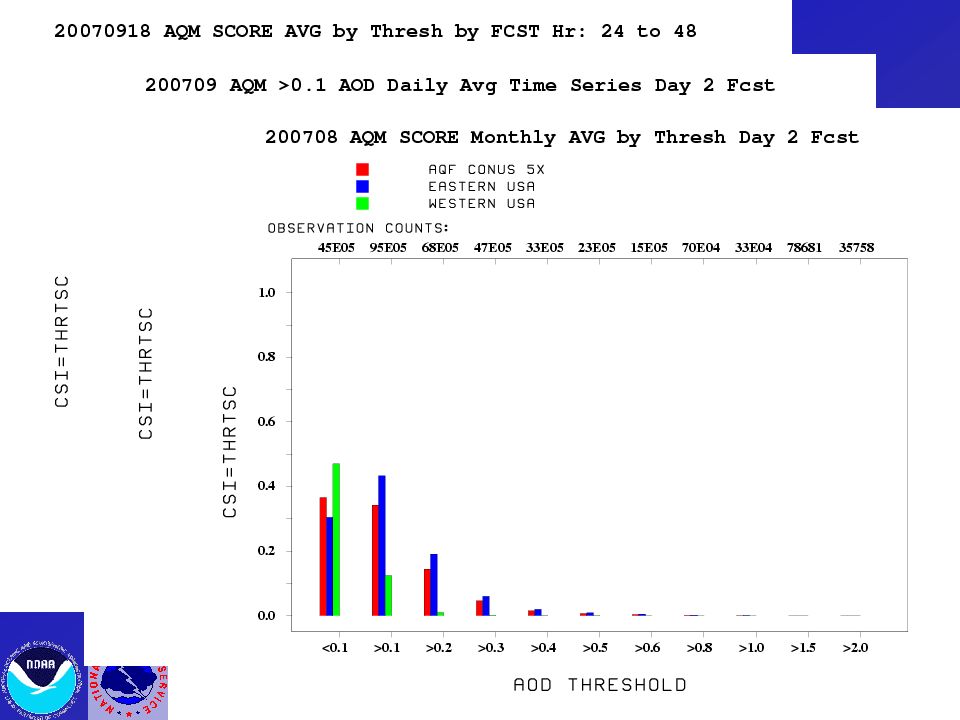
The NCEP/EMC Real-time * AOD Verification Thresholds – 0.1, >0.2, >0.3, >0.4, >0.5, >0.6, >0.8, >1.0, >1.5, and > 2.0 Skill Scores –Critical Success Index (Threat Score; CSI) –Probability of Detection (POD) –False Alarm Ratio (FAR) –#_of_Fcst / #_of_Obsv (BIAS) –Equitable Threat Score (ETS) –Accuracy rate Type of figures –Daily average time series (per month) –Daily average by threshold –Monthly average by threshold
 –Probability of Detection (POD) –False Alarm Ratio (FAR) –#_of_Fcst / #_of_Obsv (BIAS) –Equitable Threat Score (ETS) –Accuracy rate Type of figures –Daily average time series (per month) –Daily average by threshold –Monthly average by threshold")
11
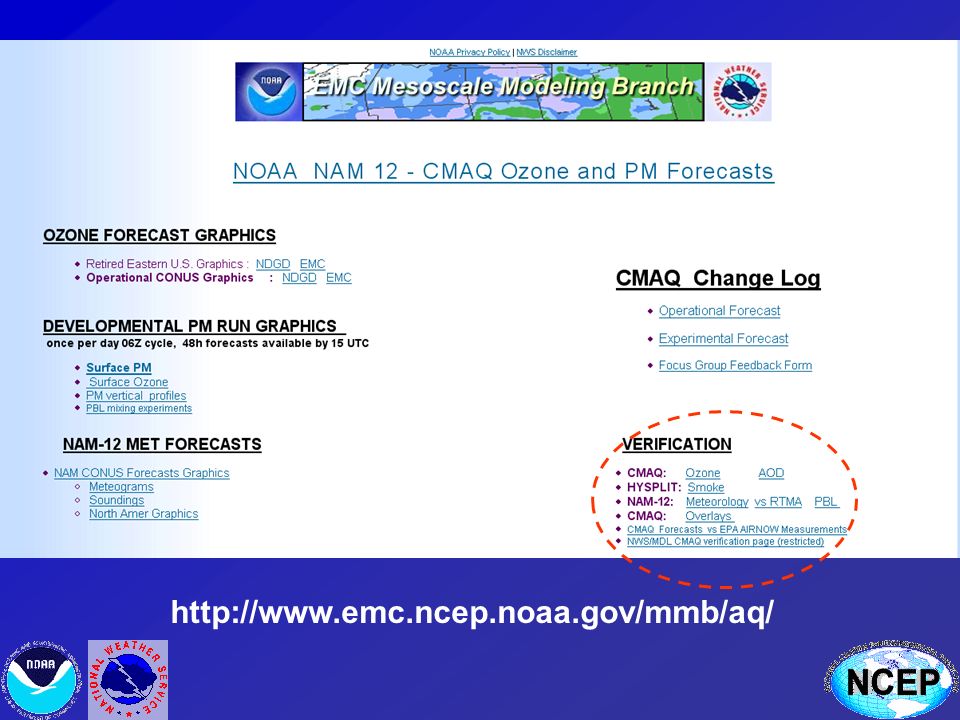
http://www.emc.ncep.noaa.gov/mmb/aq/
12
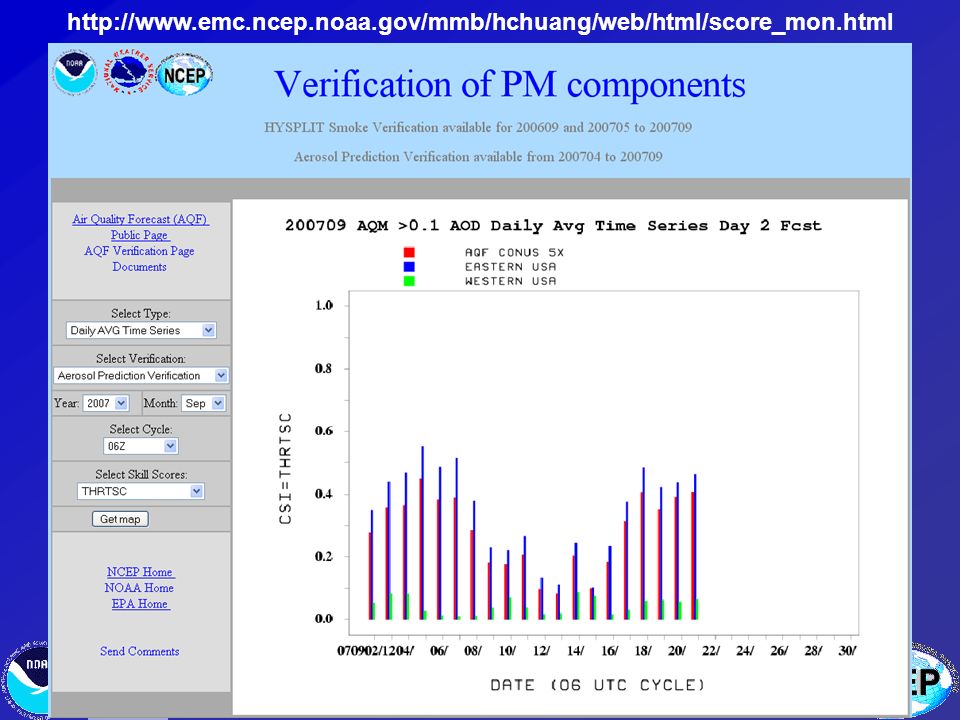
http://www.emc.ncep.noaa.gov/mmb/hchuang/web/html/score_mon.html
14
N=a+b+c+d F=a+b O=a+c H=a b c d a Forecast Observed dc NO ba YES NOYES Bias = F/O = (a+b)/(a+c) CSI = H/(F+O-H) = a/(a+b+c) POD = H/O = a/(a+c) False Alarm ratio = 1-H/F = b/(a+b) Accuracy rate = (N-F-O+2H)/N = (a+d)/(a+b+c+d)
/(a+c) CSI = H/(F+O-H) = a/(a+b+c) POD = H/O = a/(a+c) False Alarm ratio = 1-H/F = b/(a+b) Accuracy rate = (N-F-O+2H)/N = (a+d)/(a+b+c+d)")
15
F=a+b O=a+c H=a b c d a Bias : number of points < 0.1 > 0.1 > 0.2 > 0.3 > 0.4 > 0.5 > 0.6 > 0.8

16
F=a+b O=a+c H=a b c d a Probability of Detection < 0.1 > 0.1 > 0.2 > 0.3 > 0.4 > 0.5 > 0.6 > 0.8

17
AQF does not account for additional particulate sources? Inventory wild fire emissions, not real-time data Sea Salt Long range transport of dust, aerosol, and chemical species across modeling boundary

18
> 0.1 > 0.2 > 0.3 F=a+b O=a+c H=a b c d a Critical Success Index

19
X X

20
Pearson Correlation Coefficient between the AQF skill score (CSI) and the number of Null GOES data due to Cloud TOTAL DAYS = 183 CSI CLUD CONUS> 0.1NUM 167r= -0.3165r 2 = 0.1002t = -4.2852 CSI CLUD CONUS> 0.2NUM 167r= -0.2978r 2 = 0.0887t = -4.0075 CSI CLUD CONUS> 0.3NUM 167r= -0.2595r 2 = 0.0673t = -3.4512 CSI CLUD E US> 0.1NUM 167r= -0.3580r 2 = 0.1282t = -4.9254 CSI CLUD E US> 0.2NUM 167r= -0.2774r 2 = 0.0769t = -3.7087 CSI CLUD E US> 0.3NUM 167r= -0.2462r 2 = 0.0606t = -3.2630 CSI CLUD W US> 0.1NUM 167r= -0.0520r 2 = 0.0027t = -0.6686 CSI CLUD W US> 0.2NUM 167r= 0.1309r 2 = 0.0171t = 1.6958 CSI CLUD W US> 0.3NUM 167r= 0.1286r 2 = 0.0165t = 1.6661
 and the number of Null GOES data due to Cloud TOTAL DAYS = 183 CSI CLUD CONUS> 0.1NUM 167r= r 2 = t = CSI CLUD CONUS> 0.2NUM 167r= r 2 = t = CSI CLUD CONUS> 0.3NUM 167r= r 2 = t = CSI CLUD E US> 0.1NUM 167r= r 2 = t = CSI CLUD E US> 0.2NUM 167r= r 2 = t = CSI CLUD E US> 0.3NUM 167r= r 2 = t = CSI CLUD W US> 0.1NUM 167r= r 2 = t = CSI CLUD W US> 0.2NUM 167r= r 2 = t = CSI CLUD W US> 0.3NUM 167r= r 2 = t =")
21
August 2-5, 2007

22
August 15, 2007

23
SUMMARY Good spatial AQF PM distribution with low bias on the AOD unresolved PM sources or processes It is difficult to access the AQF PM skill in the western US due to strong surface reflectivity Negative correlation (in the eastern US) between the AQF PM skill score and null satellite AOD because of cloud (clear sky better skill score) was observed Further investigation is needed to understand the (non-linear) relationship between cloudiness and AQF PM skill, as well as the processes that impact AQF PM skill
 between the AQF PM skill score and null satellite AOD because of cloud (clear sky better skill score) was observed Further investigation is needed to understand the (non-linear) relationship between cloudiness and AQF PM skill, as well as the processes that impact AQF PM skill")
24
http://www.emc.ncep.noaa.gov/mmb/aq/

Similar presentations


,>")


 for the Eta-CMAQ air quality forecast model for O 3 during the 2004 ICARTT study Shaocai.>")
