Download presentation
Presentation is loading. Please wait.

1
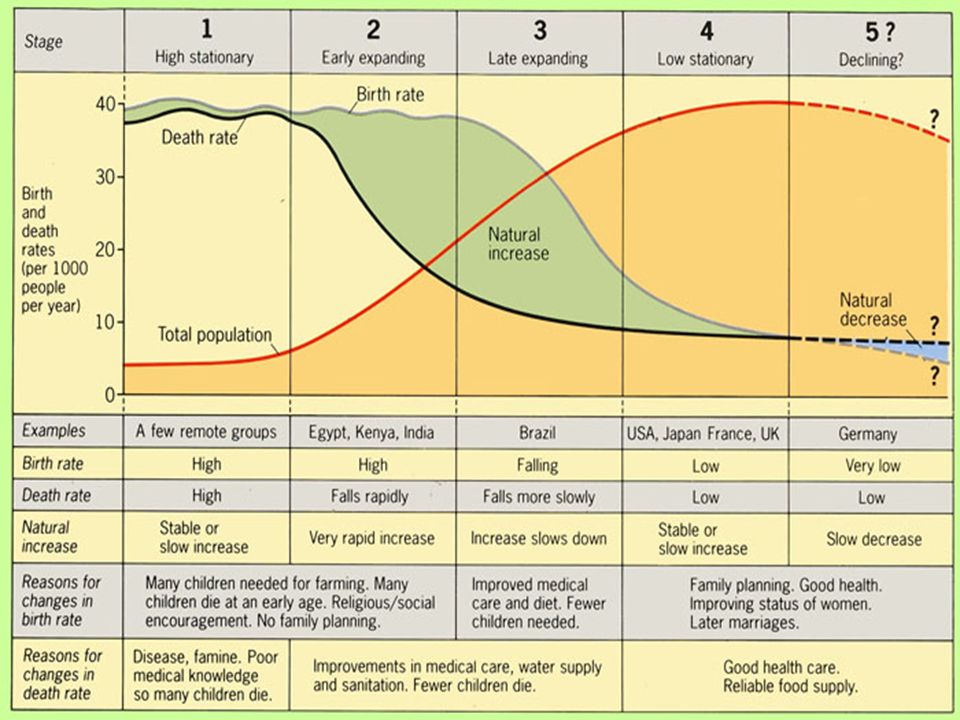
The demographic transition model LO: 1.Define birth rate, death rate and natural increase 2. Draw and annotate Demographic Transition Model and include relevant examples

2
Key terms: Birth rate: The number of live births per 1000 people per year Death rate: The number of deaths per 1000 people per year Natural Increase: The growth in population resulting from an excess of births over deaths

3
Important change for this exam board LIC: Low Income country MIC: Middle Income Country HIC: High Income Country

4
Map to show Natural Increase

7
Thinking through geography… 1.Billy White loses his job as a gravedigger. 2.Parents are now able to plan how many children they will have. 3.Children share one bedroom with their brothers and sisters. 4.There are more wedding anniversaries for couples married for 50 years. 5.A mother cries at the grave of her sixth child who has died of the disease typhoid. All of her children have died. 6.A lot more houses are being built. 7.The public health inspector smiles as the building of new drainage systems for sewage( waste material from toilets) is finished. 8.Fewer children share a bedroom with their brothers and sisters. 9.Not many grandparents alive. 10.People are encouraged to leave their home countries and settle in other lands. Read the statements and tick the box that fits what each statement describes….Birth Rate (B/R), Death Rate (D/R) or Population Change (P/C). b. Place these statements on the best place on the demographic transition model
 is finished. 8.Fewer children share a bedroom with their brothers and sisters. 9.Not many grandparents alive. 10.People are encouraged to leave their home countries and settle in other lands. Read the statements and tick the box that fits what each statement describes….Birth Rate (B/R), Death Rate (D/R) or Population Change (P/C). b. Place these statements on the best place on the demographic transition model.")
Similar presentations


 in a given year.>")


