Download presentation
Presentation is loading. Please wait.

1
Annual Report 2000

2
Average Number of Requests Processed by One Staff Member (FY 00)
")
3
Average Total Cost Per Request By Agency (FY 00)
")
4
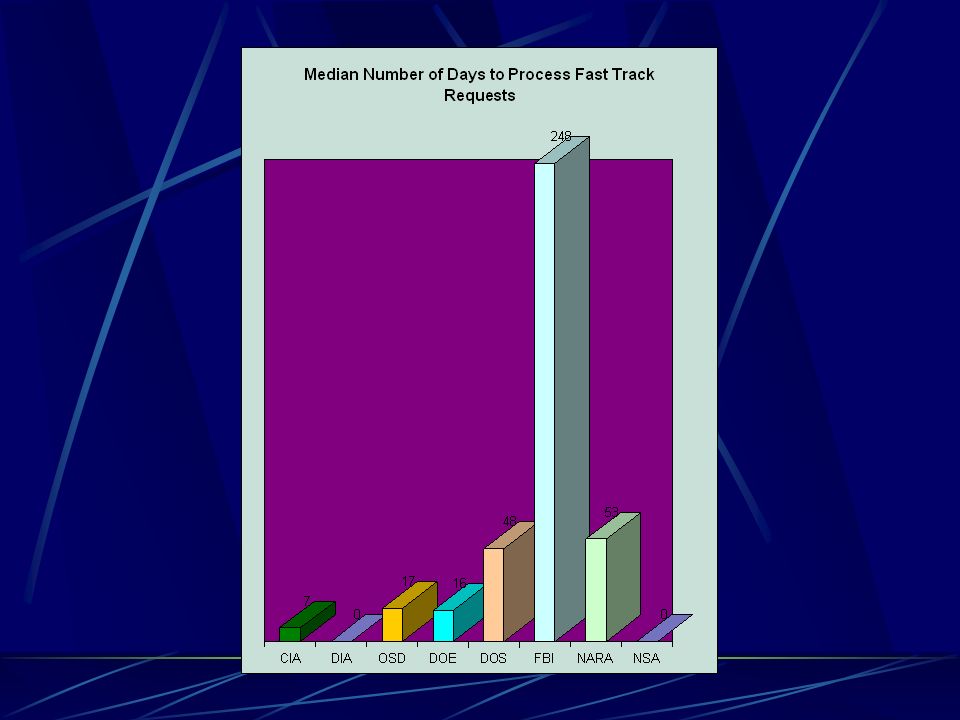
Median Number of Days Taken To Process Fast Track Requests (FY 00)
")
5
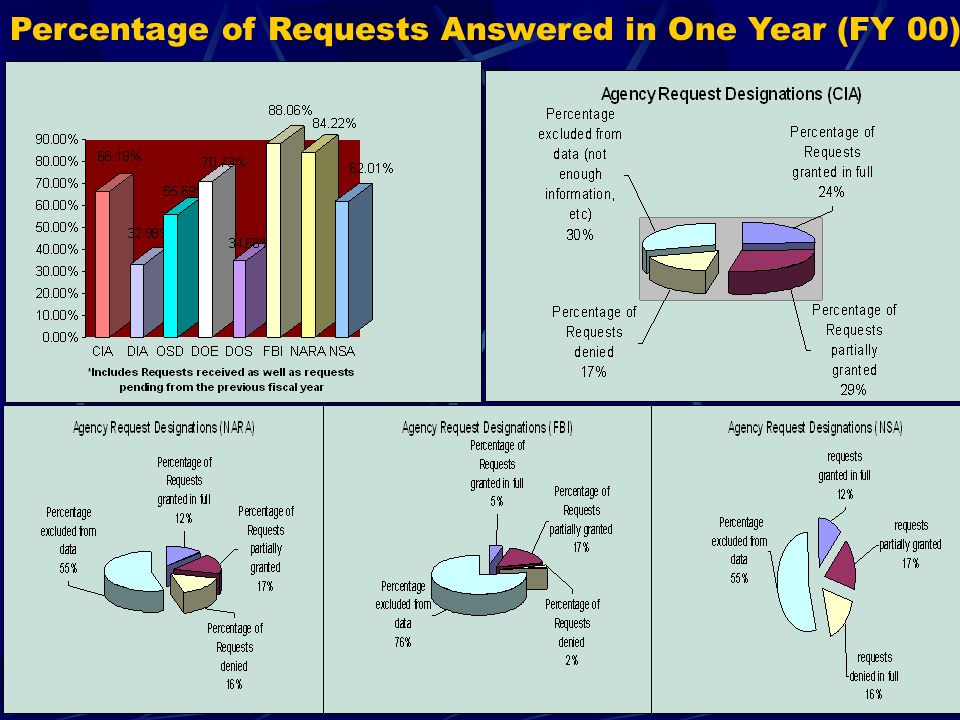
Percentage of Requests Answered in One Year (FY 00)
")
7
Annual Report 1999

8
Average Number of Requests Processed by One Staff Member (FY 99)
")
9
Average Total Cost Per Request By Agency (FY 99)
")
11
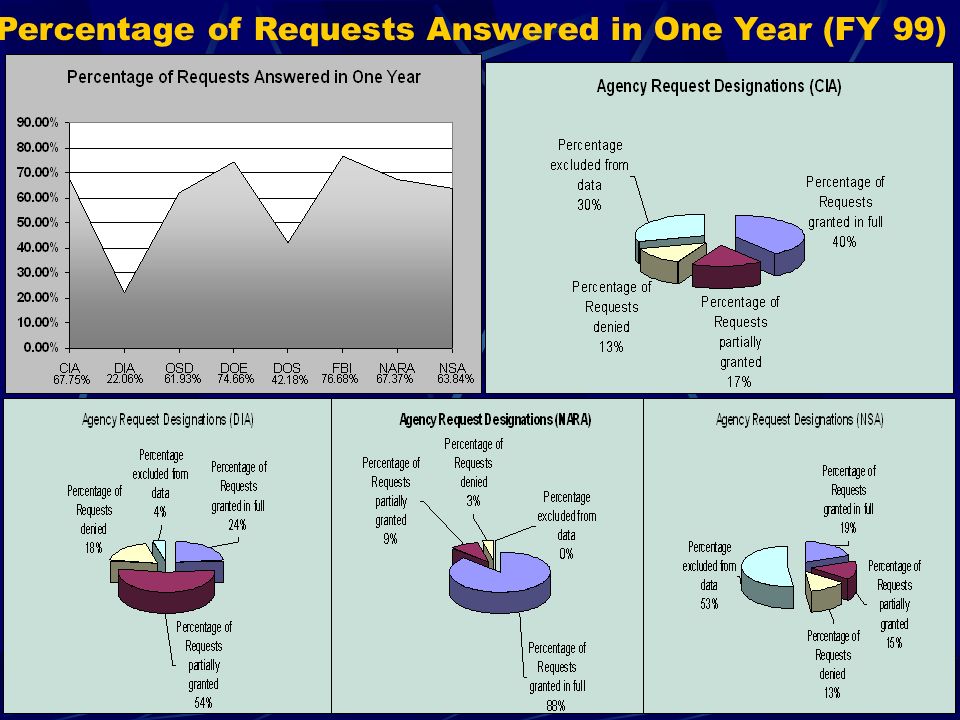
Percentage of Requests Answered in One Year (FY 99)
")
13
Annual Report FY 98

14
Average Number of Requests Processed by One Staff Member (FY 98)
")
15
Average Total Cost Per Request By Agency (FY 98)
")
16
Median Number of Day Taken To Process Fast Track Requests (FY 98)
")
17
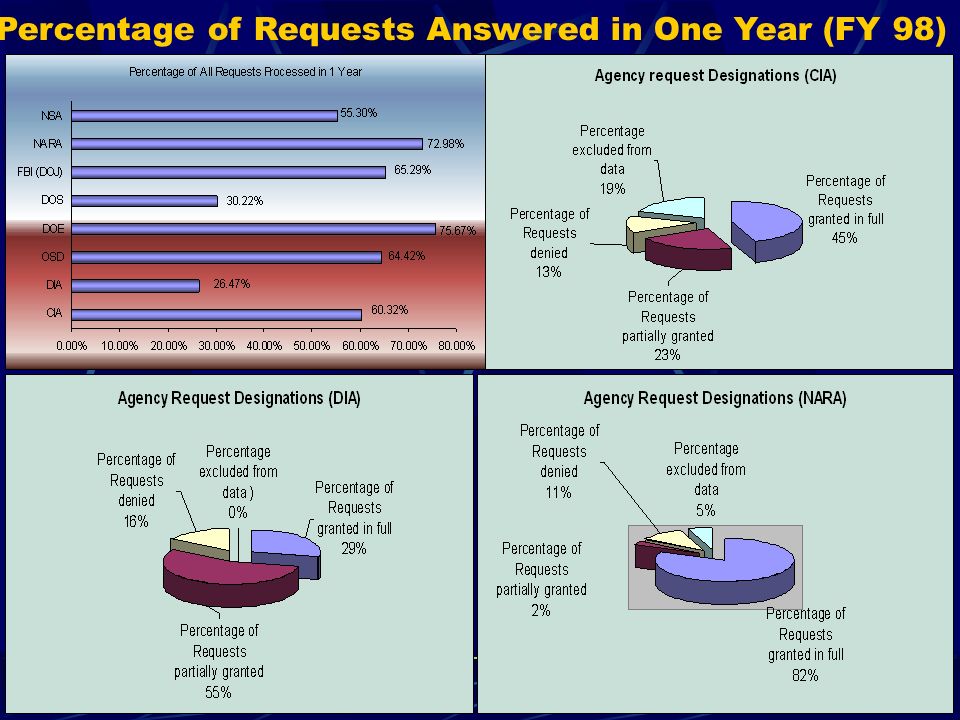
Percentage of Requests Answered in One Year (FY 98)
")
19
Notes All Annual Reports can be found on www.usdoj.govwww.usdoj.gov Any bold entries represent anomalies between values given in the annual reports and calculated values FBI values are in bold not b/c the numbers are conflicting, but to make note of the fact that the numbers are not solely for the FBI but for all of DOJ Percentage excluded from data includes a no records response, a request which was referred to another agency, a withdrawn request, a fee related issue, a request that does not reasonably describe an issue, an improper FOIA request, duplicate request, or a request for records which are not in the agency’s purview

Similar presentations


 – 20 Tenured.>")


 Provides statutory.>")

 696-4689>")


. FOIA Topics of Discussion Public Meetings Closed Meetings Meeting Notices & Agendas Electronic Communication.>")