Download presentation
Presentation is loading. Please wait.

2
Lab 4-5: Finding Epicenters

3
2:33:002:35:30 00:02:302:35:30 – 2:33:00 =

4
2:35:102:39:20 00:04:102:39:20 – 2:35:10 =

5
2:32:102:34:00 00:01:502:34:00 – 2:32:10 =

6
Let’s put the lab on pause for now…

7
How to use the P & S Wave Chart

8
We don’t know when the EQ started. But we know how much time there was between the P&S wave arrivals. Let’s say 0:04:00 C’mon let’s say it!

9
We have to find a spot on the graph where P&S (careful!) are separated by 4:00.
 are separated by 4:00.")
10
Then drop straight down to see the distance to the epicenter. 2,600km

11
Now that we know the EQ was 2,600km away, when did it start? To travel 2,600km, a P-wave… needs 5:00 minutes

12
Back to the lab… The difference in arrival time for Chicago is 0:02:30. That means that Chicago is ______ km from the epicenter. 1,400

13
Now that we know the EQ was 1,400km away, when did it start? To travel 1,400km, a P-wave… needs 3:00 minutes

14
If the P-wave was detected at 2:33:00 and needed 3:00 minutes to travel it must have started at… 2:33:00 -3:00 2:30:00

15
1,400km

16
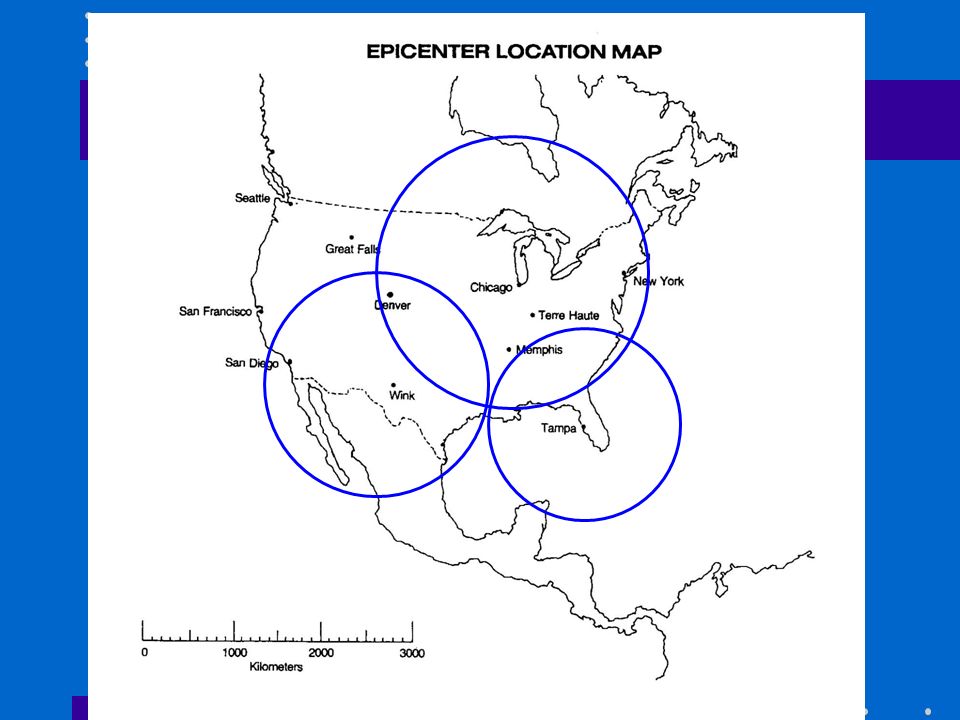
The EQ happened somewhere on this line

19
Now work on the rest of the lab.

Similar presentations


. Go ahead… do it now. You may complete the virtual lab on the website.>")


 Reading Our Reference Table!>")
