Download presentation
Presentation is loading. Please wait.

1
Lesson 7.3.2 – Teacher Notes Standard: 8.SP.A.2 Know that straight lines are widely used to model relationships between two quantitative variables. For scatter plots that suggest a linear association, informally fit a straight line, and informally assess the model fit by judging the closeness of the data points to the line. 8.SP.A.3 Use the equation of a linear model to solve problems in the context of bivariate measurement data, interpreting the slope and intercept. For example, in a linear model for a biology experiment, interpret a slope of 1.5 cm/hr as meaning that an additional hour of sunlight each day is associated with an additional 1.5 cm in mature plant height. Full mastery can be expected by the end of the chapter. Lesson Focus: The focus of this lesson is for students to interpret the line of best fit. (7-97 and 7-99) I can interpret the meaning of the slope and intercept of a linear equation in terms of the situation. I can construct a line of best fit to represent the data in a scatter plot. Calculator: No Literacy/Teaching Strategy: Swapmeet (7-99); Reciprocal Teaching (7-100)
 I can interpret the meaning of the slope and intercept of a linear equation in terms of the situation. I can construct a line of best fit to represent the data in a scatter plot. Calculator: No Literacy/Teaching Strategy: Swapmeet (7-99); Reciprocal Teaching (7-100).")
2
Bell Work

3
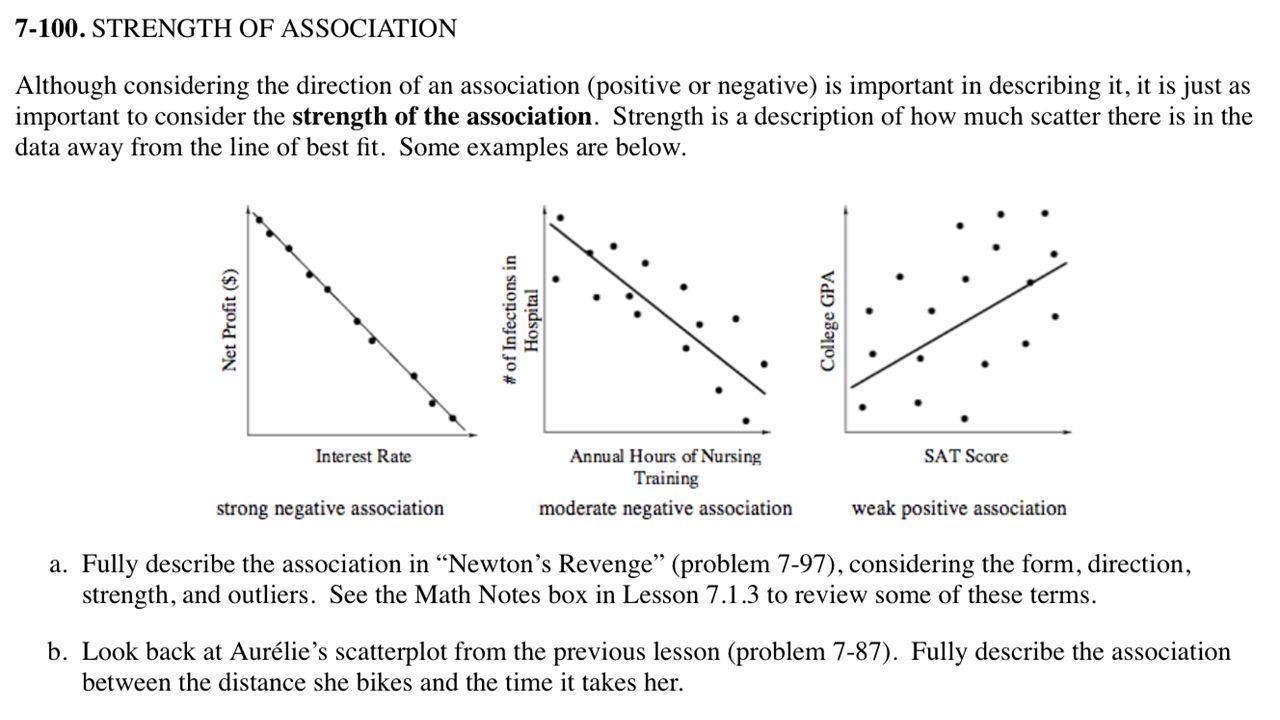
You have already seen that form, direction, and outliers can be used to describe an association. Today you will complete the description of an association by considering strength.

4
7-97. Do you remember the “Newton’s Revenge” roller-coaster problem from Chapter 1? You will now return to the problem, using your knowledge of y = mx + b to solve it. The problem (problem 1-24) is summarized below. Newton’s Revenge, the new roller coaster, has a tunnel that thrills riders with its very low ceiling. The closest the ceiling of the tunnel ever comes to the seat of the roller-coaster car is 200 cm. Although no accidents have been reported yet, it is said that very tall riders have stopped riding the roller coaster.
 is summarized below. Newton’s Revenge, the new roller coaster, has a tunnel that thrills riders with its very low ceiling. The closest the ceiling of the tunnel ever comes to the seat of the roller-coaster car is 200 cm. Although no accidents have been reported yet, it is said that very tall riders have stopped riding the roller coaster..")
5
a.To help determine whether the tunnel is safe for any rider, no matter how tall, you collected data in problem 1-24. The height and reach were both measured in centimeters. Use the data from the class at the right. Which is the dependent variable? As you plot the data, consider whether the plot is useful for making predictions. If not, can you change the plot to make it more useful?

6
b.Work with your team to draw a straight line that models the data on this graph. Use two points from the line that you drew to calculate the slope. Then find the equation of this line. Identify the variables.

7
7-98. Once you have an equation that can best represent the data in problem 7-97, you will be able to use the equation to verify that the roller coaster is safe. The amusement park wants Newton’s Revenge to be safe for tall riders. For example, remember that one of the tallest NBA players in history was Yao Ming, who is 7 feet 6 inches (about 228.6 cm) tall. Is the roller coaster safe for him? Explain.
 tall. Is the roller coaster safe for him. Explain..")
8
7-99. The slope and y ‑ intercept can sometimes give you more information about the situation you are studying, but sometimes their interpretation makes no sense. a.What is the slope of the line of best fit in Newton’s Revenge? Interpret the slope in this problem situation. Does your interpretation make sense? b.Interpret they ‑ intercept in this situation. Does your interpretation make sense? c.Make a conjecture about why your interpretation for the y ‑ intercept does not make sense in a real-world situation, but can still be part of the equation to model this situation.

10
Extra Practice

Similar presentations


 3. Using your y – intercept as a starting.>")


