Download presentation
Presentation is loading. Please wait.

1
Seismology Dylan Mikesell April 5, 2011 Boise State University

2
Seismic Waves Sources – Earthquakes – Volcanoes – Hurricanes – Oceans – Anthropogenic (e.g., traffic, mining, trains, etc.) – Nuclear explosions Show videos
 – Nuclear explosions Show videos")
3
Earthquakes http://soundwaves.usgs.gov/2009/11/FaultTypesLG.jpg

4
What do we record when earthquakes happen? Ground motion all over the world http://www.iris.edu/hq/files/programs/gsn/maps/GSN_IMS_1-2009_map.jpg

5
What does the ground motion look like? Amplitude [m] Time [s]
![What does the ground motion look like Amplitude [m] Time [s]](http://images.slideplayer.com/33/10109550/slides/slide_5.jpg "What does the ground motion look like Amplitude [m] Time [s]")
6
3 component data REV_EarthStructure.ppt

7
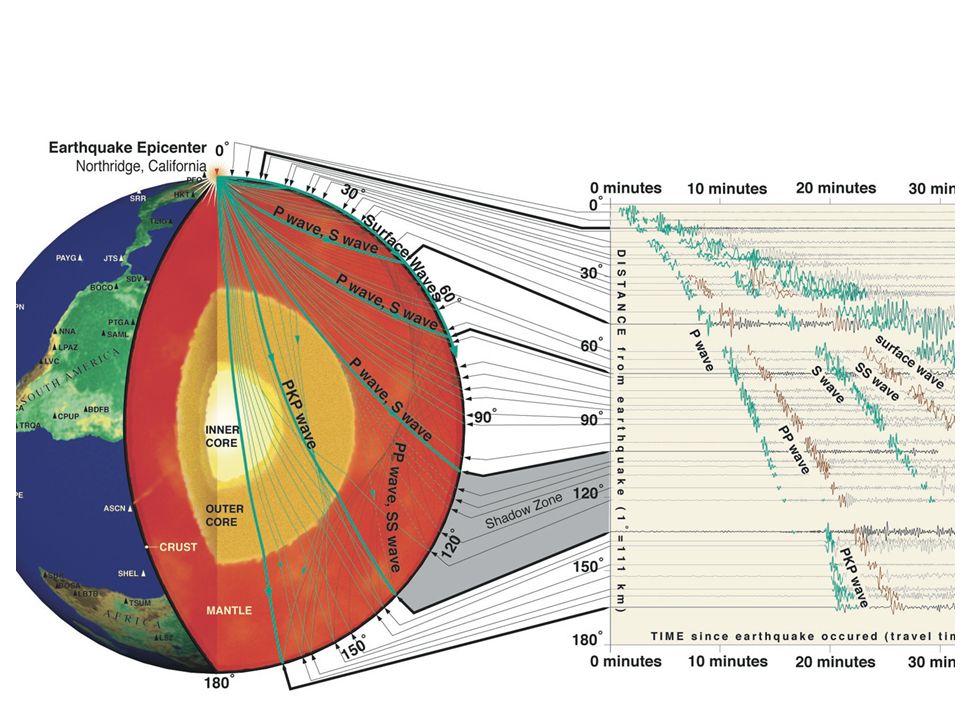
Types of waves http://web.ics.purdue.edu/~braile/edumod/as1lessons/UsingAmaSeis/UsingAmaSeis_files/image059.jpg

8
Seismic Canvas activity Based on IRIS lesson – Determining and Measuring Earth’s Layered Interior (http://www.iris.edu/hq/resource/determining_internal_structure)http://www.iris.edu/hq/resource/determining_internal_structure Students look at P wave first arrivals Compare predicted first arrivals with observed first arrivals from earthquake(s) Make inferences about 1D Earth structure
 Make inferences about 1D Earth structure")
9
Objectives IRIS Lesson – Implications: If your findings match the findings of the theoreticians then Earth is homogeneous or all rock throughout. However, if your observations do not match the theoreticians’ findings, than we can reasonably assume that the Earth is not homogenous or made entirely of rock and will need to develop a new model. New Lesson – Waveform processing (e.g., filtering, gaining, etc.) – Arrival identification – Forward modeling – Inverse modeling – Create further interests in seismology and applications
 – Arrival identification – Forward modeling – Inverse modeling – Create further interests in seismology and applications.")
10
Observational seismologists

11
Observed data

12
Improvements Frequency filtering to highlight different arrivals Signal gaining to boost low amplitudes – Could even incorporate beach ball diagrams from java_program_synthesizer.jar to look at amplitude as a function of recording position relative to fault plane and auxiliary plane Digital picking at many more stations Picking multiple earthquakes rather than just one Ability to use the same data for many lessons

13
Theoreticians Homogeneous Earth model

14
Predicted data

15
Comparison

16
Improvements Homogeneous model vs. layered model Predict arrival times at more stations Change seismic velocity Emphasize repeatability using multiple earthquakes

17
What does this tell us about Earth?

18
The ah-ha moment

20
Where do we go from here? This activity – Predict arrivals for a 2-layer model Other activities – Earthquake location using travel time curves Plate boundaries activity? – More complex waveform analysis Instrument corrections, geometric spreading correction,…? – Incorporating other wave types PP, PkP, S, surface waves, etc. – …..it’s open to anything

Similar presentations


 2006 1975 ~50 years of Hawai‘i seismicity.>")


>")


