Download presentation
Presentation is loading. Please wait.

1
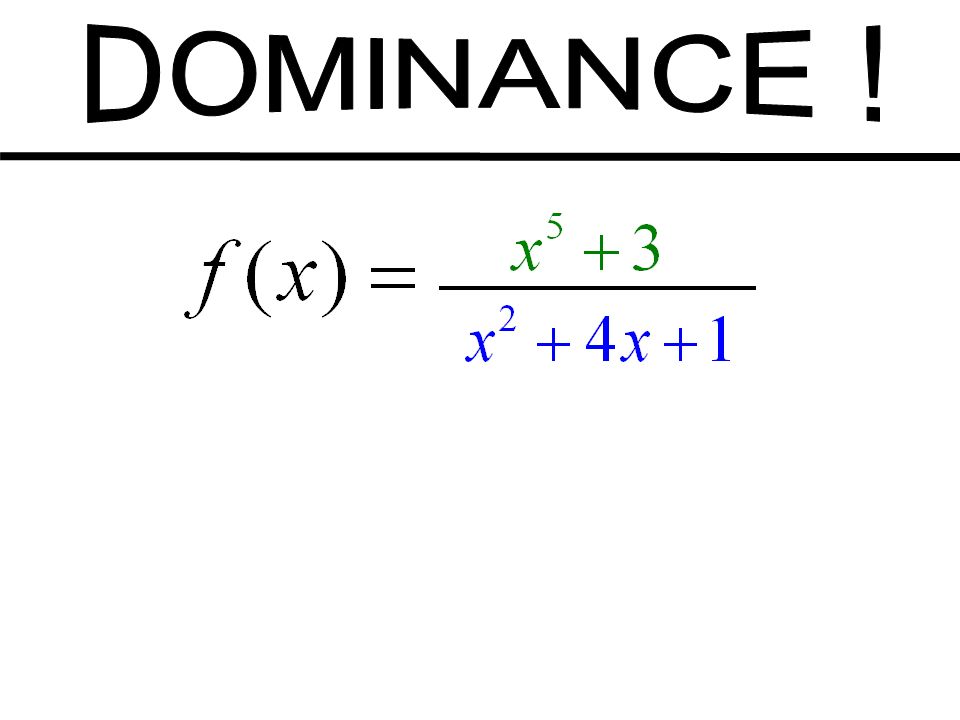
0 As x becomes extremely large (x ), which term will dominate? Lesson: _____ Section 2.6, 2.7 Graphs of Rational Functions No note taking, just show, then give the handout at end.

2
0 As x becomes extremely large (x ), what will f(x) approach?
, what will f(x) approach")
3
Ex. Sketch the graph of the rational function

4
What happens to f(x) if p = 0? What happens to f(x) if q = 0?
 if p = 0 What happens to f(x) if q = 0")
5
G RAPHING R ATIONAL F UNCTIONS GRAPHS OF RATIONAL FUNCTIONS C ONCEPT S UMMARY Let p (x ) and q (x ) be polynomials with no common factors other than 1.The graph of the rational function has the following characteristics. f (x ) = = a m x m + a m – 1 x m – 1 + … + a 1 x + a 0 b n x n + b n – 1 x n – 1 + … + b 1 x + b 0 p (x )q (x )p (x )q (x ) 1. x - intercepts are the real zeros of p (x ) 2. vertical asymptote at each real zero of q (x ) 3. at most one horizontal asymptote
 = = a m x m + a m – 1 x m – 1 + … + a 1 x + a 0 b n x n + b n – 1 x n – 1 + … + b 1 x + b 0 p (x )q (x )p (x )q (x ) 1. x - intercepts are the real zeros of p (x ) 2. vertical asymptote at each real zero of q (x ) 3. at most one horizontal asymptote.")
6
3. at most one horizontal asymptote at each zero of q (x ) G RAPHING R ATIONAL F UNCTIONS GRAPHS OF RATIONAL FUNCTIONS C ONCEPT S UMMARY f (x ) = = a m x m + a m – 1 x m – 1 + … + a 1 x + a 0 b n x n + b n – 1 x n – 1 + … + b 1 x + b 0 p (x )q (x )p (x )q (x ) If m > n, the graph has no horizontal asymptote. If m < n, the line y = 0 is a horizontal asymptote. If m = n, the line y = is a horizontal asymptote. a mb na mb n
 G RAPHING R ATIONAL F UNCTIONS GRAPHS OF RATIONAL FUNCTIONS C ONCEPT S UMMARY f (x ) = = a m x m + a m – 1 x m – 1 + … + a 1 x + a 0 b n x n + b n – 1 x n – 1 + … + b 1 x + b 0 p (x )q (x )p (x )q (x ) If m > n, the graph has no horizontal asymptote. If m < n, the line y = 0 is a horizontal asymptote. If m = n, the line y = is a horizontal asymptote. a mb na mb n.")
7
As x becomes extremely large (x ), what will f(x) approach? As x becomes extremely large (x ), who will dominate the fraction, the numerator or the denominator?
, who will dominate the fraction, the numerator or the denominator .")
8
3x 2 - 4x + 3

10
Graphing a Rational Function (m < n) The bell-shaped graph passes through (–3, 0.4), (– 1, 2), (0, 4), (1,2), and (3, 0.4). The domain is all real numbers; the range is 0 < y 4. Graph y =. 4 x 2 + 1 State domain and range. S OLUTION The numerator has no zeros, so there is no x -intercept. The denominator has no real zeros, so there is no vertical asymptote. The degree of the numerator (0) is less than the degree of the denominator (2), so the line y = 0 (the x-axis) is a horizontal asymptote.
 is less than the degree of the denominator (2), so the line y = 0 (the x-axis) is a horizontal asymptote..")
11
Graphing a Rational Function (m = n) Graph y =. 3x 2 x 2 – 4 The degree of the numerator (2) is equal to the degree of the denominator (2), so the horizontal asymptote is y = = 3. ambnambn S OLUTION The numerator has 0 as its only zero, so the graph has one x -intercept at (0, 0). The denominator can be factored as (x + 2)(x – 2), so the denominator has zeros at 2 and – 2. This implies vertical asymptotes at x = – 2 and x = 2.
 is equal to the degree of the denominator (2), so the horizontal asymptote is y = = 3. ambnambn S OLUTION The numerator has 0 as its only zero, so the graph has one x -intercept at (0, 0). The denominator can be factored as (x + 2)(x – 2), so the denominator has zeros at 2 and – 2. This implies vertical asymptotes at x = – 2 and x = 2..")
12
To the left of x = – 2 To the right of x = 2 Between x = – 2 and x = 2 Graphing a Rational Function (m = n) To draw the graph, plot points between and beyond vertical asymptotes. Graph y =. 3x 2 x 2 – 4 4 5.4 –1 0 –1 5.4 4 – 4 – 3 –1 0 1 3 4 xy xy

13
Graphing a Rational Function (m > n) Graph y =. x 2 – 2x – 3 x + 4 The degree of the numerator (2) is greater than the degree of the denominator (1), so there is no horizontal asymptote and the end behavior of the graph of f is the same as the end behavior of the graph of y = x 2 – 1 = x. S OLUTION The numerator can be factored as ( x – 3) and ( x + 1); the x -intercepts are 3 and –1. The only zero of the denominator is – 4, so the only vertical asymptote is x = – 4.
 is greater than the degree of the denominator (1), so there is no horizontal asymptote and the end behavior of the graph of f is the same as the end behavior of the graph of y = x 2 – 1 = x. S OLUTION The numerator can be factored as ( x – 3) and ( x + 1); the x -intercepts are 3 and –1. The only zero of the denominator is – 4, so the only vertical asymptote is x = – 4..")
14
Graphing a Rational Function (m > n) To draw the graph, plot points to the left and right of the vertical asymptote. To the left of x = – 4 To the right of x = – 4 Graph y =. x 2 – 2x – 3 x + 4 – 20.6 –19.2 – 22.5 2.5 – 0.75 – 0.5 0.63 2.1 –12 – 9 – 6 – 2 0 2 4 6 y xy xy

15
Graphing a Rational Function (m > n) To draw the graph, plot points to the left and right of the vertical asymptote. To the left of x = – 4 To the right of x = – 4 Graph y =. x 2 – 2x – 3 x + 4 – 20.6 –19.2 – 22.5 2.5 – 0.75 – 0.5 0.63 2.1 –12 – 9 – 6 – 2 0 2 4 6 y xy xy It has what we call a diagonal or “slant” asymptote! Notice anything interesting about this graph? To find the equation of this line, use Long Division. - ( )
.")
16
Slant Asymptotes If the degree of the numerator is exactly one degree more than the denominator, then there is a slant asymptote. To find it, use Long Division *see Geogebra Also explore dividing each term by 5x 2

Similar presentations


 and q (x ) be polynomials with no common factors other than 1.The.>")


 = 0. Then the function given by is a rational.>")


 Graph y =. State the domain and range. 6 x 2 + 1 SOLUTION The degree of the numerator, 0, is less than the.>")

 = √x. y = 3√x – 1 y = -1/2√x y = - √(x-1) + 2.>")

