Download presentation
Presentation is loading. Please wait.

1
Statistical Inference Making decisions regarding the population base on a sample

2
Decision Types Estimation –Deciding on the value of an unknown parameter Hypothesis Testing –Deciding a statement regarding an unknown parameter is true of false All decisions will be based on the values of statistics Prediction –Deciding the future value of a random variable

3
Estimation Definitions –An estimator of an unknown parameter is a sample statistic used for this purpose –An estimate is the value of the estimator after the data is collected The performance of an estimator is assessed by determining its sampling distribution and measuring its closeness to the parameter being estimated

4
Examples of Estimators

5
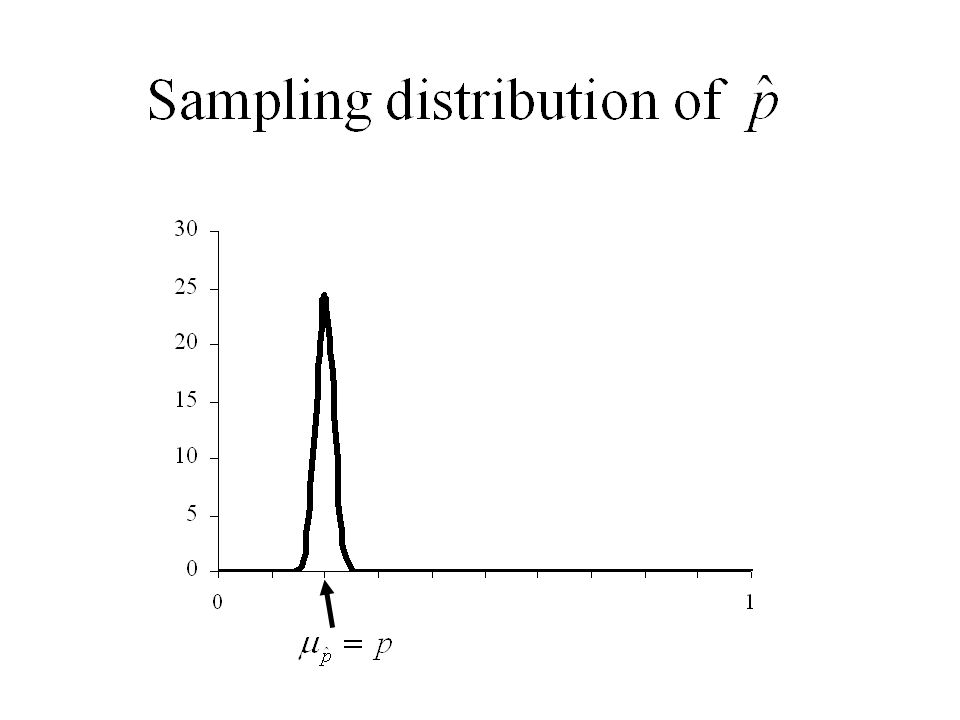
The Sample Proportion Let p = population proportion of interest or binomial probability of success. Let is a normal distribution with = sample proportion or proportion of successes.

7
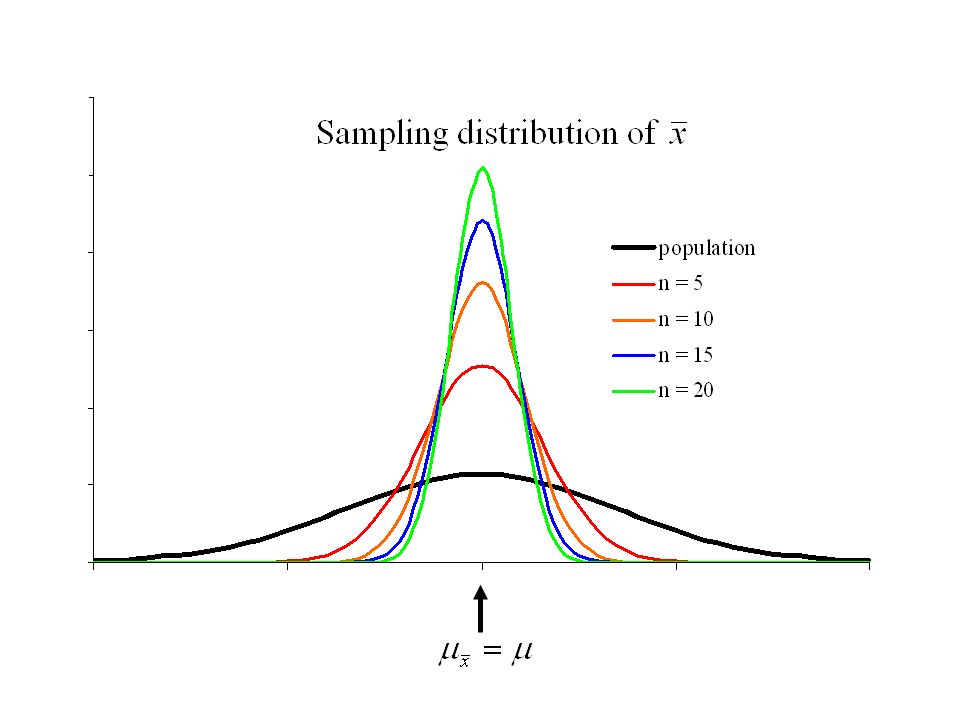
The Sample Mean Let x 1, x 2, x 3, …, x n denote a sample of size n from a normal distribution with mean and standard deviation . Let is a normal distribution with

9
Confidence Intervals

10
Estimation by Confidence Intervals Definition –An (100) P% confidence interval of an unknown parameter is a pair of sample statistics (t 1 and t 2 ) having the following properties: 1. P[t 1 < t 2 ] = 1. That is t 1 is always smaller than t 2. 2. P[the unknown parameter lies between t 1 and t 2 ] = P. the statistics t 1 and t 2 are random variables Property 2. states that the probability that the unknown parameter is bounded by the two statistics t 1 and t 2 is P.

11
Critical values for a distribution The upper critical value for a any distribution is the point x underneath the distribution such that P[X > x ] = xx
![Critical values for a distribution The upper critical value for a any distribution is the point x underneath the distribution such that P[X > x ] = xx](http://images.slideplayer.com/32/10092710/slides/slide_11.jpg "Critical values for a distribution The upper critical value for a any distribution is the point x underneath the distribution such that P[X > x ] = xx")
12
Critical values for the standard Normal distribution P[Z > z ] = zz
![Critical values for the standard Normal distribution P[Z > z ] = zz](http://images.slideplayer.com/32/10092710/slides/slide_12.jpg "Critical values for the standard Normal distribution P[Z > z ] = zz")
13
Critical values for the standard Normal distribution P[Z > z ] =
![Critical values for the standard Normal distribution P[Z > z ] = ](http://images.slideplayer.com/32/10092710/slides/slide_13.jpg "Critical values for the standard Normal distribution P[Z > z ] = ")
14
Confidence Intervals for a proportion p Then t 1 to t 2 is a (1 – )100% = P100% confidence interval for p and Let
100% = P100% confidence interval for p and Let")
15
Logic: Thus t 1 to t 2 is a (1 – )100% = P100% confidence interval for p has a Standard Normal distribution and Then Hence
100% = P100% confidence interval for p has a Standard Normal distribution and Then Hence")
16
Example Suppose we are interested in determining the success rate of a new drug for reducing Blood Pressure The new drug is given to n = 70 patients with abnormally high Blood Pressure Of these patients to X = 63 were able to reduce the abnormally high level of Blood Pressure The proportion of patients able to reduce the abnormally high level of Blood Pressure was This is an estimate of p.

17
Then Thus a 95% confidence interval for p is 0.8297 to 0.9703 and If P = 1 – = 0.95 then /2 =.025 and z = 1.960 This comes from the Table

18
What is the probability that p is beween 0.8297 and 0.9703? Is it 95% ? Answer: p (unknown), 0.8297 and 0.9703 are numbers. Either p is between 0.8297 and 0.9703 or it is not. The 95% refers to success of confidence interval procedure prior to the collection of the data. After the data is collected it was either successful in capturing p or it was not.
, and are numbers. Either p is between and or it is not. The 95% refers to success of confidence interval procedure prior to the collection of the data. After the data is collected it was either successful in capturing p or it was not..")
19
Statistical Inference Making decisions regarding the population base on a sample

20
Two Areas of Statistical Inference Estimation Hypothesis Testing

21
Estimation Definitions –An estimator of an unknown parameter is a sample statistic used for this purpose –An estimate is the value of the estimator after the data is collected The performance of an estimator is assessed by determining its sampling distribution and measuring its closeness to the parameter being estimated

22
Confidence Intervals Estimation of a parameter by a range of values (an interval)
")
23
Estimation by Confidence Intervals Definition –An (100) P% confidence interval of an unknown parameter is a pair of sample statistics (t 1 and t 2 ) having the following properties: 1. P[t 1 < t 2 ] = 1. That is t 1 is always smaller than t 2. 2. P[the unknown parameter lies between t 1 and t 2 ] = P. the statistics t 1 and t 2 are random variables Property 2. states that the probability that the unknown parameter is bounded by the two statistics t 1 and t 2 is P.

24
100(1 – )% Confidence Interval for the population proportion: Confidence Interval for a Proportion Interpretation: For about 100(1 – )P% of all randomly selected samples from the population, the confidence interval computed in this manner captures the population proportion.
% Confidence Interval for the population proportion: Confidence Interval for a Proportion Interpretation: For about 100(1 – )P% of all randomly selected samples from the population, the confidence interval computed in this manner captures the population proportion.")
25
Comment The usual choices of are 0.05 and 0.01 In this case the level of confidence, 100(1 - )%, is 95% and 99% respectively Also the tabled value z /2 is: z 0.025 = 1.960 and z 0.005 = 2.576 respectively
%, is 95% and 99% respectively Also the tabled value z /2 is: z = and z = respectively")
26
Example Suppose we are interested in determining the success rate of a new drug for reducing Blood Pressure The new drug is given to n = 70 patients with abnormally high Blood Pressure Of these patients to X = 63 were able to reduce the abnormally high level of Blood Pressure The proportion of patients able to reduce the abnormally high level of Blood Pressure was This is an estimate of p.

27
Then Thus a 95% confidence interval for p is 0.8297 to 0.9703 and If P = 1 – = 0.95 then /2 =.025 and z = 1.960 This comes from the Table

28
What is the probability that p is beween 0.8297 and 0.9703? Is it 95% ? Answer: p (unknown), 0.8297 and 0.9703 are numbers. Either p is between 0.8297 and 0.9703 or it is not. The 95% refers to success of confidence interval procedure prior to the collection of the data. After the data is collected it was either successful in capturing p or it was not.
, and are numbers. Either p is between and or it is not. The 95% refers to success of confidence interval procedure prior to the collection of the data. After the data is collected it was either successful in capturing p or it was not..")
29
Error Bound For a (1 – )% confidence level, the approximate margin of error in a sample proportion is
% confidence level, the approximate margin of error in a sample proportion is")
30
Factors that Determine the Error Bound 1. The sample size, n. When sample size increases, margin of error decreases. 2. The sample proportion,. If the proportion is close to either 1 or 0 most individuals have the same trait or opinion, so there is little natural variability and the margin of error is smaller than if the proportion is near 0.5. 3. The “multiplier” z /2. Co nnected to the “(1 – )%” level of confindence of the Error Bound. The value of z /2 for a 95% level of confidence is 1.96 This value is changed to change the level of confidence.
% level of confindence of the Error Bound. The value of z /2 for a 95% level of confidence is 1.96 This value is changed to change the level of confidence..")
31
Determination of Sample Size In almost all research situations the researcher is interested in the question: How large should the sample be?

32
Answer: Depends on: How accurate you want the answer. Accuracy is specified by: Specifying the magnitude of the error bound Level of confidence

33
Error Bound: If we have specified the level of confidence then the value of z a/2 will be known. If we have specified the magnitude of B, it will also be known Solving for n we get:

34
Summarizing: The sample size that will estimate p with an Error Bound B and level of confidence P = 1 – is: where: B is the desired Error Bound z is the /2 critical value for the standard normal distribution p* is some preliminary estimate of p. If you do not have a preliminary estimate of p, use p* = 0.50

35
Reason For p* = 0.50 n will take on the largest value. Thus using p* = 0.50, n may be larger than required if p is not 0.50. but will give the desired accuracy or better for all values of p.

36
Example Suppose that I want to conduct a survey and want to estimate p = proportion of voters who favour a downtown location for a casino: I know that the approximate value of p is p* = 0.50. This is also a good choice for p if one has no preliminary estimate of its value. I want the survey to estimate p with an error bound B = 0.01 (1 percentage point) I want the level of confidence to be 95% (i.e. = 0.05 and z = z = 1.960 Then
 I want the level of confidence to be 95% (i.e. = 0.05 and z = z = Then.")
37
Confidence Intervals for the mean, , of a Normal Population

38
Confidence Intervals for the mean of a Normal Population, Then t 1 to t 2 is a (1 – )100% = P100% confidence interval for Let and
100% = P100% confidence interval for Let and")
39
Logic: Thus t 1 to t 2 is a (1 – )100% = P100% confidence interval for has a Standard Normal distribution and Then Hence
100% = P100% confidence interval for has a Standard Normal distribution and Then Hence")
40
Example Suppose we are interested average Bone Mass Density (BMD) for women aged 70-75 A sample n = 100 women aged 70-75 are selected and BMD is measured for eahc individual in the sample. The average BMD for these individuals is: The standard deviation (s) of BMD for these individuals is:
 of BMD for these individuals is:.")
41
Then Thus a 95% confidence interval for is 24.10 to 27.16 and If P = 1 – = 0.95 then /2 =.025 and z = 1.960

42
Determination of Sample Size Again a question to be asked: How large should the sample be?

43
Answer: Depends on: How accurate you want the answer. Accuracy is specified by: Specifying the magnitude of the error bound Level of confidence

44
Error Bound: If we have specified the level of confidence then the value of z /2 will be known. If we have specified the magnitude of B, it will also be known Solving for n we get:

45
Summarizing: The sample size that will estimate with an Error Bound B and level of confidence P = 1 – is: where: B is the desired Error Bound z is the /2 critical value for the standard normal distribution s* is some preliminary estimate of .

46
Notes: n increases as B, the desired Error Bound, decreases –Larger sample size required for higher level of accuracy n increases as the level of confidence, (1 – ), increases –z increases as /2 becomes closer to zero. –Larger sample size required for higher level of confidence n increases as the standard deviation, , of the population increases. –If the population is more variable then a larger sample size required

47
Summary: The sample size n depends on: Desired level of accuracy Desired level of confidence Variability of the population

48
Example Suppose that one is interested in estimating the average number of grams of fat (m) in one kilogram of lean beef hamburger : This will be estimated by: randomly selecting one kilogram samples, then Measuring the fat content for each sample. Preliminary estimates of and indicate: –that and are approximately 220 and 40 respectively. I want the study to estimate with an error bound 5 and a level of confidence to be 95% (i.e. = 0.05 and z = z = 1.960)
.")
49
Solution Hence n = 246 one kilogram samples are required to estimate within B = 5 gms with a 95% level of confidence.

50
Statistical Inference Making decisions regarding the population base on a sample

51
Decision Types Estimation –Deciding on the value of an unknown parameter Hypothesis Testing –Deciding a statement regarding an unknown parameter is true of false All decisions will be based on the values of statistics Prediction –Deciding the future value of a random variable

52
Estimation Definitions –An estimator of an unknown parameter is a sample statistic used for this purpose –An estimate is the value of the estimator after the data is collected The performance of an estimator is assessed by determining its sampling distribution and measuring its closeness to the parameter being estimated

53
Comments When you use a single statistic to estimate a parameter it is called a point estimator The estimate is a single value The accuracy of this estimate cannot be determined from this value A better way to estimate is with a confidence interval. The width of this interval gives information on its accuracy

54
Estimation by Confidence Intervals Definition –An (100) P% confidence interval of an unknown parameter is a pair of sample statistics (t 1 and t 2 ) having the following properties: 1. P[t 1 < t 2 ] = 1. That is t 1 is always smaller than t 2. 2. P[the unknown parameter lies between t 1 and t 2 ] = P. the statistics t 1 and t 2 are random variables Property 2. states that the probability that the unknown parameter is bounded by the two statistics t 1 and t 2 is P.

55
Confidence Intervals Summary

56
Confidence Interval for a Proportion

57
The sample size that will estimate p with an Error Bound B and level of confidence P = 1 – is: where: B is the desired Error Bound z is the /2 critical value for the standard normal distribution p* is some preliminary estimate of p. Determination of Sample Size

58
Confidence Intervals for the mean of a Normal Population,

59
The sample size that will estimate with an Error Bound B and level of confidence P = 1 – is: where: B is the desired Error Bound z is the /2 critical value for the standard normal distribution s* is some preliminary estimate of s. Determination of Sample Size

60
Hypothesis Testing An important area of statistical inference

61
Definition Hypothesis (H) –Statement about the parameters of the population In hypothesis testing there are two hypotheses of interest. –The null hypothesis (H 0 ) –The alternative hypothesis (H A )
 –The alternative hypothesis (H A ).")
62
Either –null hypothesis (H 0 ) is true or –the alternative hypothesis (H A ) is true. But not both We say that are mutually exclusive and exhaustive.

63
One has to make a decision –to either to accept null hypothesis (equivalent to rejecting H A ) or –to reject null hypothesis (equivalent to accepting H A )
 or –to reject null hypothesis (equivalent to accepting H A )")
64
There are two possible errors that can be made. 1.Rejecting the null hypothesis when it is true. (type I error) 2.accepting the null hypothesis when it is false (type II error)
 2.accepting the null hypothesis when it is false (type II error).")
65
An analogy – a jury trial The two possible decisions are –Declare the accused innocent. –Declare the accused guilty.

66
The null hypothesis (H 0 ) – the accused is innocent The alternative hypothesis (H A ) – the accused is guilty
 – the accused is innocent The alternative hypothesis (H A ) – the accused is guilty")
67
The two possible errors that can be made: –Declaring an innocent person guilty. (type I error) –Declaring a guilty person innocent. (type II error) Note: in this case one type of error may be considered more serious
 –Declaring a guilty person innocent. (type II error) Note: in this case one type of error may be considered more serious.")
68
Decision Table showing types of Error H 0 is TrueH 0 is False Correct Decision Type I Error Type II Error Accept H 0 Reject H 0

69
To define a statistical Test we 1.Choose a statistic (called the test statistic) 2.Divide the range of possible values for the test statistic into two parts The Acceptance Region The Critical Region
 2.Divide the range of possible values for the test statistic into two parts The Acceptance Region The Critical Region")
70
To perform a statistical Test we 1.Collect the data. 2.Compute the value of the test statistic. 3.Make the Decision: If the value of the test statistic is in the Acceptance Region we decide to accept H 0. If the value of the test statistic is in the Critical Region we decide to reject H 0.

71
Example We are interested in determining if a coin is fair. i.e.H 0 : p = probability of tossing a head = ½. To test this we will toss the coin n = 10 times. The test statistic is x = the number of heads. This statistic will have a binomial distribution with p = ½ and n = 10 if the null hypothesis is true.

72
Sampling distribution of x when H 0 is true

73
Note We would expect the test statistic x to be around 5 if H 0 : p = ½ is true. Acceptance Region = {3, 4, 5, 6, 7}. Critical Region = {0, 1, 2, 8, 9, 10}. The reason for the choice of the Acceptance region: Contains the values that we would expect for x if the null hypothesis is true.

74
Definitions: For any statistical testing procedure define = P[Rejecting the null hypothesis when it is true] = P[ type I error] = P[accepting the null hypothesis when it is false] = P[ type II error]
![Definitions: For any statistical testing procedure define = P[Rejecting the null hypothesis when it is true] = P[ type I error] = P[accepting the null hypothesis when it is false] = P[ type II error]](http://images.slideplayer.com/32/10092710/slides/slide_74.jpg "Definitions: For any statistical testing procedure define = P[Rejecting the null hypothesis when it is true] = P[ type I error] = P[accepting the null hypothesis when it is false] = P[ type II error]")
75
In the last example = P[ type I error] = p(0) + p(1) + p(2) + p(8) + p(9) + p(10) = 0.109, where p(x) are binomial probabilities with p = ½ and n = 10. = P[ type II error] = p(3) + p(4) + p(5) + p(6) + p(7), where p(x) are binomial probabilities with p (not equal to ½) and n = 10. Note: these will depend on the value of p.
![In the last example = P[ type I error] = p(0) + p(1) + p(2) + p(8) + p(9) + p(10) = 0.109, where p(x) are binomial probabilities with p = ½ and n = 10.](http://images.slideplayer.com/32/10092710/slides/slide_75.jpg " = P[ type II error] = p(3) + p(4) + p(5) + p(6) + p(7), where p(x) are binomial probabilities with p (not equal to ½) and n = 10. Note: these will depend on the value of p..")
76
Table: Probability of a Type II error, vs. p Note: the magnitude of increases as p gets closer to ½.

77
Comments: 1.You can control = P[ type I error] and = P[ type II error] by widening or narrowing the acceptance region.. 2.Widening the acceptance region decreases = P[ type I error] but increases = P[ type II error]. 3.Narrowing the acceptance region increases = P[ type I error] but decreases = P[ type II error].
![Comments: 1.You can control = P[ type I error] and = P[ type II error] by widening or narrowing the acceptance region..](http://images.slideplayer.com/32/10092710/slides/slide_77.jpg "2.Widening the acceptance region decreases = P[ type I error] but increases = P[ type II error]. 3.Narrowing the acceptance region increases = P[ type I error] but decreases = P[ type II error]..")
78
Example – Widening the Acceptance Region 1.Suppose the Acceptance Region includes in addition to its previous values 2 and 8 then = P[ type I error] = p(0) + p(1) + p(9) + p(10) = 0.021, where again p(x) are binomial probabilities with p = ½ and n = 10. = P[ type II error] = p(2) + p(3) + p(4) + p(5) + p(6) + p(7) + p(8). Tabled values of are given on the next page.
![Example – Widening the Acceptance Region 1.Suppose the Acceptance Region includes in addition to its previous values 2 and 8 then = P[ type I error] = p(0) + p(1) + p(9) + p(10) = 0.021, where again p(x) are binomial probabilities with p = ½ and n = 10.](http://images.slideplayer.com/32/10092710/slides/slide_78.jpg " = P[ type II error] = p(2) + p(3) + p(4) + p(5) + p(6) + p(7) + p(8). Tabled values of are given on the next page..")
79
Table: Probability of a Type II error, vs. p Note: Compare these values with the previous definition of the Acceptance Region. They have increased,

80
Example – Narrowing the Acceptance Region 1.Suppose the original Acceptance Region excludes the values 3 and 7. That is the Acceptance Region is {4,5,6}. Then = P[ type I error] = p(0) + p(1) + p(2) + p(3) + p(7) + p(8) +p(9) + p(10) = 0.344. = P[ type II error] = p(4) + p(5) + p(6). Tabled values of are given on the next page.
 + p(1) + p(2) + p(3) + p(7) + p(8) +p(9) + p(10) = = P[ type II error] = p(4) + p(5) + p(6). Tabled values of are given on the next page..")
81
Table: Probability of a Type II error, vs. p Note: Compare these values with the otiginal definition of the Acceptance Region. They have decreased,

82
Acceptance Region {4,5,6}. Acceptance Region {3,4,5,6,7}. Acceptance Region {2,3,4,5,6,7,8}. = 0.344 = 0.109 = 0.021

83
Hypothesis Testing An important area of statistical inference

84
Definition Hypothesis (H) –Statement about the parameters of the population In hypothesis testing there are two hypotheses of interest. –The null hypothesis (H 0 ) –The alternative hypothesis (H A )
 –The alternative hypothesis (H A ).")
85
Either –null hypothesis (H 0 ) is true or –the alternative hypothesis (H A ) is true. But not both We say that are mutually exclusive and exhaustive.

86
Decision Table showing types of Error H 0 is TrueH 0 is False Correct Decision Type I Error Type II Error Accept H 0 Reject H 0

87
The Approach in Statistical Testing is: Set up the Acceptance Region so that is close to some predetermine value (the usual values are 0.05 or 0.01) The predetermine value of (0.05 or 0.01) is called the significance level of the test. The significance level of the test is = P[test makes a type I error]

88
Determining the Critical Region 1.The Critical Region should consist of values of the test statistic that indicate that H A is true. (hence H 0 should be rejected). 2.The size of the Critical Region is determined so that the probability of making a type I error, , is at some pre-determined level. (usually 0.05 or 0.01). This value is called the significance level of the test. Significance level = P[test makes type I error]
. 2.The size of the Critical Region is determined so that the probability of making a type I error, , is at some pre-determined level. (usually 0.05 or 0.01). This value is called the significance level of the test. Significance level = P[test makes type I error].")
89
To find the Critical Region 1.Find the sampling distribution of the test statistic when is H 0 true. 2.Locate the Critical Region in the tails (either left or right or both) of the sampling distribution of the test statistic when is H 0 true. Whether you locate the critical region in the left tail or right tail or both tails depends on which values indicate H A is true. The tails chosen = values indicating H A.
 of the sampling distribution of the test statistic when is H 0 true. Whether you locate the critical region in the left tail or right tail or both tails depends on which values indicate H A is true. The tails chosen = values indicating H A..")
90
3.the size of the Critical Region is chosen so that the area over the critical region and under the sampling distribution of the test statistic when is H 0 true is the desired level of =P[type I error] Sampling distribution of test statistic when H 0 is true Critical Region - Area =
![3.the size of the Critical Region is chosen so that the area over the critical region and under the sampling distribution of the test statistic when is H 0 true is the desired level of =P[type I error] Sampling distribution of test statistic when H 0 is true Critical Region - Area = ](http://images.slideplayer.com/32/10092710/slides/slide_90.jpg "3.the size of the Critical Region is chosen so that the area over the critical region and under the sampling distribution of the test statistic when is H 0 true is the desired level of =P[type I error] Sampling distribution of test statistic when H 0 is true Critical Region - Area = ")
91
The z-test for Proportions Testing the probability of success in a binomial experiment

92
Situation A success-failure experiment has been repeated n times The probability of success p is unknown. We want to test –H 0 : p = p 0 (some specified value of p) Against –H A :
 Against –H A :.")
93
The Data The success-failure experiment has been repeated n times The number of successes x is observed. Obviously if this proportion is close to p 0 the Null Hypothesis should be accepted otherwise the null Hypothesis should be rejected.

94
The Test Statistic To decide to accept or reject the Null Hypothesis (H 0 ) we will use the test statistic If H 0 is true we should expect the test statistic z to be close to zero. If H 0 is true we should expect the test statistic z to have a standard normal distribution. If H A is true we should expect the test statistic z to be different from zero.

95
The sampling distribution of z when H 0 is true: The Standard Normal distribution Accept H 0 Reject H 0

96
The Acceptance region: /2 Accept H 0 Reject H 0

97
Acceptance Region –Accept H 0 if: Critical Region –Reject H 0 if: With this Choice

98
Summary To Test for a binomial probability p H 0 : p = p 0 (some specified value of p) Against H A : we 1.Decide on = P[Type I Error] = the significance level of the test (usual choices 0.05 or 0.01)
![Summary To Test for a binomial probability p H 0 : p = p 0 (some specified value of p) Against H A : we 1.Decide on = P[Type I Error] = the significance level of the test (usual choices 0.05 or 0.01)](http://images.slideplayer.com/32/10092710/slides/slide_98.jpg "Summary To Test for a binomial probability p H 0 : p = p 0 (some specified value of p) Against H A : we 1.Decide on = P[Type I Error] = the significance level of the test (usual choices 0.05 or 0.01)")
99
2.Collect the data 3.Compute the test statistic 4.Make the Decision Accept H 0 if: Reject H 0 if:

100
Example In the last provincial election the proportion of the voters who voted for the Liberal party was 0.08 (8 %) The party is interested in determining if that percentage has changed A sample of n = 800 voters are surveyed
 The party is interested in determining if that percentage has changed A sample of n = 800 voters are surveyed")
101
We want to test –H 0 : p = 0.08 (8%) Against –H A :
 Against –H A :")
102
Summary 1.Decide on = P[Type I Error] = the significance level of the test Choose ( = 0.05) 2.Collect the data The number in the sample that support the liberal party is x = 92
![Summary 1.Decide on = P[Type I Error] = the significance level of the test Choose ( = 0.05) 2.Collect the data The number in the sample that support the liberal party is x = 92](http://images.slideplayer.com/32/10092710/slides/slide_102.jpg "Summary 1.Decide on = P[Type I Error] = the significance level of the test Choose ( = 0.05) 2.Collect the data The number in the sample that support the liberal party is x = 92")
103
3.Compute the test statistic 4.Make the Decision Accept H 0 if: Reject H 0 if:

104
Since the test statistic is in the Critical region we decide to Reject H 0 Conclude that H 0 : p = 0.08 (8%) is false There is a significant difference ( = 5%) in the proportion of the voters supporting the liberal party in this election than in the last election
 is false There is a significant difference ( = 5%) in the proportion of the voters supporting the liberal party in this election than in the last election")
105
The two-tailed z-test for Proportions Testing the probability of success in a binomial experiment

106
Situation A success-failure experiment has been repeated n times The probability of success p is unknown. We want to test –H 0 : p = p 0 (some specified value of p) Against –H A :
 Against –H A :.")
107
The Test Statistic To decide to accept or reject the Null Hypothesis (H 0 ) we will use the test statistic
 we will use the test statistic")
108
Acceptance Region –Accept H 0 if: Critical Region –Reject H 0 if: With this Choice

109
The Acceptance region: /2 Accept H 0 Reject H 0

110
The one tailed z-test A success-failure experiment has been repeated n times The probability of success p is unknown. We want to test –H 0 : (some specified value of p) Against –H A : The alternative hypothesis is in this case called a one-sided alternative
 Against –H A : The alternative hypothesis is in this case called a one-sided alternative.")
111
The Test Statistic To decide to accept or reject the Null Hypothesis (H 0 ) we will use the test statistic If H 0 is true we should expect the test statistic z to be close to zero or negative If p = p 0 we should expect the test statistic z to have a standard normal distribution. If H A is true we should expect the test statistic z to be a positive number.

112
The sampling distribution of z when p = p 0 : The Standard Normal distribution Accept H 0 Reject H 0

113
The Acceptance and Critical region: Accept H 0 Reject H 0

114
Acceptance Region –Accept H 0 if: Critical Region –Reject H 0 if: The Critical Region is called one-tailed With this Choice

115
Example A new surgical procedure is developed for correcting heart defects infants before the age of one month. Previously the procedure was used on infants that were older than one month and the success rate was 91% A study is conducted to determine if the success rate of the new procedure is greater than 91% (n = 200)
.")
116
We want to test –H 0 : Against –H A :

117
Summary 1.Decide on = P[Type I Error] = the significance level of the test Choose ( = 0.05) 2.Collect the data The number of successful operations in the sample of 200 cases is x = 187
![Summary 1.Decide on = P[Type I Error] = the significance level of the test Choose ( = 0.05) 2.Collect the data The number of successful operations in the sample of 200 cases is x = 187](http://images.slideplayer.com/32/10092710/slides/slide_117.jpg "Summary 1.Decide on = P[Type I Error] = the significance level of the test Choose ( = 0.05) 2.Collect the data The number of successful operations in the sample of 200 cases is x = 187")
118
3.Compute the test statistic 4.Make the Decision Accept H 0 if: Reject H 0 if:

119
Since the test statistic is in the Acceptance region we decide to Accept H 0 There is a no significant ( = 5%) increase in the success rate of the new procedure over the older procedure Conclude that H 0 : is true More precisely H 0 can’t be rejected
 increase in the success rate of the new procedure over the older procedure Conclude that H 0 : is true More precisely H 0 can’t be rejected")
120
Comments When the decision is made to accept H 0 is made one should not conclude that we have proven H 0. This is because when setting up the test we have not controlled = P[type II error] = P[accepting H 0 when H 0 is FALSE] Whenever H 0 is accepted there is a possibility that a type II error has been made.

121
In the last example The conclusion that there is a no significant ( = 5%) increase in the success rate of the new procedure over the older procedure should be interpreted: We have been unable to proof that the new procedure is better than the old procedure
 increase in the success rate of the new procedure over the older procedure should be interpreted: We have been unable to proof that the new procedure is better than the old procedure")
122
Some other comments: When does one use a two-tailed test? When does one use a one tailed test? Answer: This depends on the alternative hypothesis H A. Critical Region = values that indicate H A Thus if only the upper tail indicates H A, the test is one tailed. If both tails indicate H A, the test is two tailed.

123
Also: The alternative hypothesis H A usually corresponds to the research hypothesis (the hypothesis that the researcher is trying to prove) 1.The new procedure is better 2.The drug is effective in reducing levels of cholesterol. 3.There has a change in political opinion from the time the survey was taken till the present time (time of current survey).
..")
124
The z-test for the Mean of a Normal Population We want to test, , denote the mean of a normal population

125
Situation A sample of n observations are collected from a Normal distribution The mean of the Normal distribution, , is unknown. We want to test –H 0 : = 0 (some specified value of ) Against –H A :
 Against –H A :.")
126
The Data Let x 1, x 2, x 3, …, x n denote a sample from a normal population with mean and standard deviation . Let we want to test if the mean, , is equal to some given value 0. Obviously if the sample mean is close to 0 the Null Hypothesis should be accepted otherwise the null Hypothesis should be rejected.

127
The Test Statistic To decide to accept or reject the Null Hypothesis (H 0 ) we will use the test statistic If H 0 is true we should expect the test statistic z to be close to zero. If H 0 is true we should expect the test statistic z to have a standard normal distribution. If H A is true we should expect the test statistic z to be different from zero.

128
The sampling distribution of z when H 0 is true: The Standard Normal distribution Accept H 0 Reject H 0

129
The Acceptance region: /2 Accept H 0 Reject H 0

130
Acceptance Region –Accept H 0 if: Critical Region –Reject H 0 if: With this Choice

131
Summary To Test for mean , of a normal population H 0 : = 0 (some specified value of ) Against H A : 1.Decide on = P[Type I Error] = the significance level of the test (usual choices 0.05 or 0.01)
![Summary To Test for mean , of a normal population H 0 : = 0 (some specified value of ) Against H A : 1.Decide on = P[Type I Error] = the significance level of the test (usual choices 0.05 or 0.01)](http://images.slideplayer.com/32/10092710/slides/slide_131.jpg "Summary To Test for mean , of a normal population H 0 : = 0 (some specified value of ) Against H A : 1.Decide on = P[Type I Error] = the significance level of the test (usual choices 0.05 or 0.01)")
132
2.Collect the data 3.Compute the test statistic 4.Make the Decision Accept H 0 if: Reject H 0 if:

133
Example A manufacturer Glucosamine capsules claims that each capsule contains on the average: 500 mg of glucosamine To test this claim n = 40 capsules were selected and amount of glucosamine (X) measured in each capsule. Summary statistics:

134
We want to test: Manufacturers claim is correct against Manufacturers claim is not correct

135
The Test Statistic

136
The Critical Region and Acceptance Region Using = 0.05 We accept H 0 if -1.960 ≤ z ≤ 1.960 z /2 = z 0.025 = 1.960 reject H 0 if z 1.960

137
The Decision Since z= -2.75 < -1.960 We reject H 0 Conclude: the manufacturers’s claim is incorrect:

138
Hypothesis Testing A review of the concepts

139
In hypotheses testing there are two hypotheses 1.The Null Hypothesis (H 0 ) 2.The Alternative Hypothesis (H A ) The alternative hypothesis is usually the research hypothesis - the hypothesis that the researcher is trying to prove. The null hypothesis is the hypothesis that the research hypothesis is not true.

140
A statistical Test is defined by 1.Choosing a statistic (called the test statistic) 2.Dividing the range of possible values for the test statistic into two parts The Acceptance Region The Critical Region
 2.Dividing the range of possible values for the test statistic into two parts The Acceptance Region The Critical Region")
141
To perform a statistical Test we 1.Collect the data. 2.Compute the value of the test statistic. 3.Make the Decision: If the value of the test statistic is in the Acceptance Region we decide to accept H 0. If the value of the test statistic is in the Critical Region we decide to reject H 0.

142
You can compare a statistical test to a meter Value of test statistic Acceptance Region Critical Region Critical Region Critical Region is the red zone of the meter

143
Value of test statistic Acceptance Region Critical Region Critical Region Accept H 0

144
Value of test statistic Acceptance Region Critical Region Critical Region Reject H 0

145
Acceptance Region Critical Region Sometimes the critical region is located on one side. These tests are called one tailed tests.

146
Whether you use a one tailed test or a two tailed test depends on: 1.The hypotheses being tested (H 0 and H A ). 2.The test statistic.

147
If only large positive values of the test statistic indicate H A then the critical region should be located in the positive tail. (1 tailed test) If only large negative values of the test statistic indicate H A then the critical region should be located in the negative tail. (1 tailed test) If both large positive and large negative values of the test statistic indicate H A then the critical region should be located both the positive and negative tail. (2 tailed test)
 If only large negative values of the test statistic indicate H A then the critical region should be located in the negative tail. (1 tailed test) If both large positive and large negative values of the test statistic indicate H A then the critical region should be located both the positive and negative tail. (2 tailed test).")
148
Usually 1 tailed tests are appropriate if H A is one-sided. Two tailed tests are appropriate if H A is two - sided. But not always

149
Once the test statistic is determined, to set up the critical region we have to find the sampling distribution of the test statistic when H 0 is true This describes the behaviour of the test statistic when H 0 is true

150
We then locate the critical region in the tails of the sampling distribution of the test statistic when H 0 is true The size of the critical region is chosen so that the area over the critical region is . /2

151
This ensures that the P[type I error] = P[rejecting H 0 when true] = /2
![This ensures that the P[type I error] = P[rejecting H 0 when true] = /2](http://images.slideplayer.com/32/10092710/slides/slide_151.jpg "This ensures that the P[type I error] = P[rejecting H 0 when true] = /2")
152
To find P[type II error] = P[ accepting H 0 when false] = we need to find the sampling distribution of the test statistic when H 0 is false /2 sampling distribution of the test statistic when H 0 is false sampling distribution of the test statistic when H 0 is true
![To find P[type II error] = P[ accepting H 0 when false] = we need to find the sampling distribution of the test statistic when H 0 is false /2 sampling distribution of the test statistic when H 0 is false sampling distribution of the test statistic when H 0 is true](http://images.slideplayer.com/32/10092710/slides/slide_152.jpg "To find P[type II error] = P[ accepting H 0 when false] = we need to find the sampling distribution of the test statistic when H 0 is false /2 sampling distribution of the test statistic when H 0 is false sampling distribution of the test statistic when H 0 is true")
153
The p-value approach to Hypothesis Testing

154
1.A test statistic 2.A Critical and Acceptance region for the test statistic In hypothesis testing we need The Critical Region is set up under the sampling distribution of the test statistic. Area = (0.05 or 0.01) above the critical region. The critical region may be one tailed or two tailed
 above the critical region. The critical region may be one tailed or two tailed.")
155
The Critical region: /2 Accept H 0 Reject H 0

156
1.Computing the value of the test statistic 2.Making the decision a.Reject if the value is in the Critical region and b.Accept if the value is in the Acceptance region. In test is carried out by

157
The value of the test statistic may be in the Acceptance region but close to being in the Critical region, or The it may be in the Critical region but close to being in the Acceptance region. To measure this we compute the p-value.

158
Definition – Once the test statistic has been computed form the data the p-value is defined to be: p-value = P[the test statistic is as or more extreme than the observed value of the test statistic] more extreme means giving stronger evidence to rejecting H 0
![Definition – Once the test statistic has been computed form the data the p-value is defined to be: p-value = P[the test statistic is as or more extreme than the observed value of the test statistic] more extreme means giving stronger evidence to rejecting H 0](http://images.slideplayer.com/32/10092710/slides/slide_158.jpg "Definition – Once the test statistic has been computed form the data the p-value is defined to be: p-value = P[the test statistic is as or more extreme than the observed value of the test statistic] more extreme means giving stronger evidence to rejecting H 0")
159
Example – Suppose we are using the z –test for the mean of a normal population and = 0.05. Z 0.025 = 1.960 p-value = P[the test statistic is as or more extreme than the observed value of the test statistic] = P [ z > 2.3] + P[z < -2.3] = 0.0107 + 0.0107 = 0.0214 Thus the critical region is to reject H 0 if Z 1.960. Suppose the z = 2.3, then we reject H 0

160
p - value 2.3 -2.3 Graph

161
p-value = P[the test statistic is as or more extreme than the observed value of the test statistic] = P [ z > 1.2] + P[z < -1.2] = 0.1151 + 0.1151 = 0.2302 If the value of z = 1.2, then we accept H 0 23.02% chance that the test statistic is as or more extreme than 1.2. Fairly high, hence 1.2 is not very extreme
![p-value = P[the test statistic is as or more extreme than the observed value of the test statistic] = P [ z > 1.2] + P[z < -1.2] = = If the value of z = 1.2, then we accept H % chance that the test statistic is as or more extreme than 1.2.](http://images.slideplayer.com/32/10092710/slides/slide_161.jpg "Fairly high, hence 1.2 is not very extreme.")
162
p - value 1.2 -1.2 Graph

163
Properties of the p -value 1.If the p-value is small (<0.05 or 0.01) H 0 should be rejected. 2.The p-value measures the plausibility of H 0. 3.If the test is two tailed the p-value should be two tailed. 4. If the test is one tailed the p-value should be one tailed. 5.It is customary to report p-values when reporting the results. This gives the reader some idea of the strength of the evidence for rejecting H 0

164
Summary A common way to report statistical tests is to compute the p-value. If the p-value is small ( < 0.05 or < 0.01) then H 0 is rejected. If the p-value is extremely small this gives a strong indication that H A is true. If the p-value is marginally above the threshold 0.05 then we cannot reject H 0 but there would be a suspicion that H 0 is false.
 then H 0 is rejected. If the p-value is extremely small this gives a strong indication that H A is true. If the p-value is marginally above the threshold 0.05 then we cannot reject H 0 but there would be a suspicion that H 0 is false..")
165
Next topic: Student’s t - testStudent’s t - test

Similar presentations

 2.Divide the range of possible values for the test.>")


 REJECT Compute the Sample Mean.>")


 p-Value Approach to Hypothesis Testing.>")


