Download presentation
Presentation is loading. Please wait.

1
AGENDA: QUIZ #3 --- 30 minutes30 minutes Work Day PW Lesson #11:CLT Begin Unit 1 Lesson #12 UNIT 1 TEST 1 Thursday DG9 Fri

2
Accel Precalc Unit #1: Data Analysis Lesson #12: Confidence Intervals For Means EQ: How do you use confidence intervals to estimate population means and proportions?

3
Terms to Recall Statistics ---measures of a sample; also called point estimates Parameters--- measures of a population

4
What are some statistics and parameters we have discussed thus far? MeasureStatisticParameters Mean Standard Deviation s In theory you will never know parameters. That is why you use statistics to estimate.

5
New Terms: Interval Estimates --- interval of values used to estimate a parameter Ex. average age of students might be in an interval 17.9 < < 18.7or 18.3 ± 0.4 years 0.4 is called the margin of error

6
Confidence Level --- probability that the confidence interval will contain the true parameter. Confidence Interval --- specific interval estimate for a population parameter determined by using statistics obtained from a sample.

7
AGENDA Finish Notes Lesson 12 Conf Int for MEans Study Topics for Unit 1 Test 1

11
See Table C for critical values Common Confidence Intervals: 90%, 95%, 99% Use the Table C to determine the corresponding t* value for each interval when n is very large. Confidence Level = 90% t*= 1.645 90% 5% 1.645

12
Confidence Level = 95% Confidence Level = 99% t*= 1.96 1.96 95% 2.5% 99% 0.5% t*= 2.576 2.576

13
Verify by finding the probability under the curve at the given z values.

14
Formula for Confidence Intervals For Means: RECALL: Standard Error

15
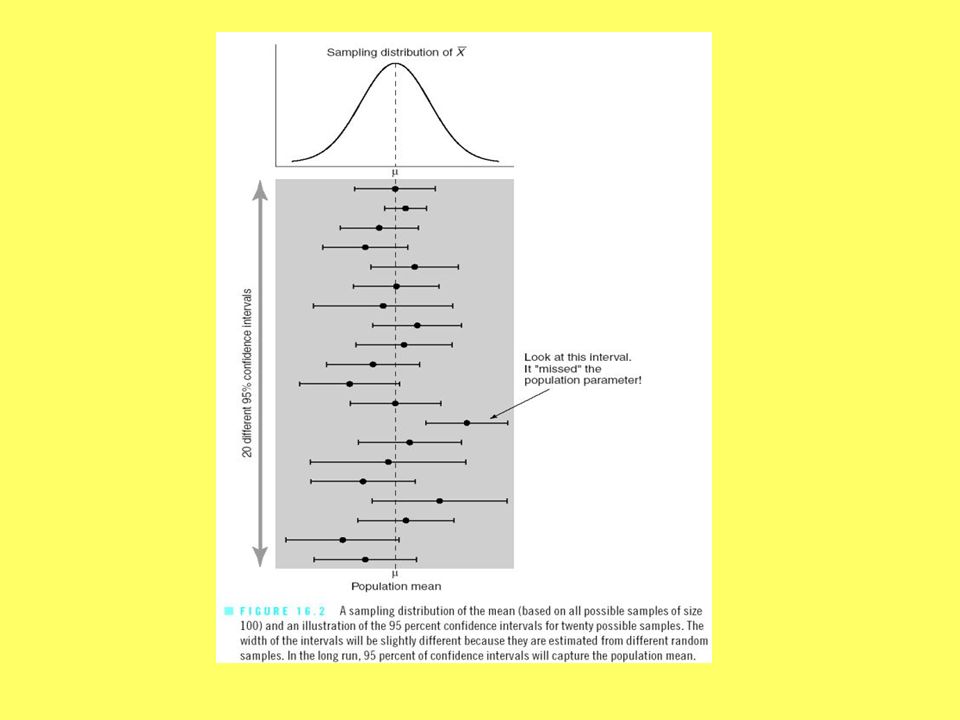
Uses a t-distribution and degrees of freedom where df = n - 1 Recall:Central Limit Theorem When the sample size is large enough, 95% of the sample means will fall within 1.96 standard deviations of the true parameter.

16
This means for a 95% confidence interval: Write the general formula for:

17
Ex 1 Find the t* values for the following then write the general formula for the confidence interval. a) 90% conf int when sample size is 22 t*= 1.721 Confidence Level = 90%n = 22df = 21
 90% conf int when sample size is 22 t*= Confidence Level = 90%n = 22df = 21.")
18
b) 95% conf int when sample size is 15 c) 99 th percentile when sample size is 30 Confidence Level = 95% Confidence Level = 98% WHY? n = 15 n = 30 df = 14 df = 29 t*= 2.145 t*= 2.462

19
Confidence Interval Statement: We are _______% confident the true population mean __________________ ___________________________ is between _______ and _________ for a sample size n = ______.

20
In Class Examples. Place formula and work on your own paper. Make a conclusion statement in context of the problem. 1.A researcher wishes to estimate the average of money a person spends on lottery tickets each month. A sample of 50 people who play the lottery found the mean to $19 and the standard deviation to be 6.8. Find the best point estimate of the population and the 95% confidence interval of the population mean. Confidence Level = 95% n = 50 df = 49t*= 2.021

21
Confidence Interval Statement: We are _______% confident the true population mean __________________ ___________________________ is between _______ and _________ for a sample size n = ______. 95 of money a person spends on lottery tickets each month $17.06$20.94 50

22
2. The following data represent a sample of the assets (in millions of dollars) of 30 credit unions in southwestern Pennsylvania. Find the 90% confidence interval of the mean.
 of 30 credit unions in southwestern Pennsylvania. Find the 90% confidence interval of the mean..")
23
3. A study of 30 marathon runners showed that they could run at an average of 7.8 miles per hour. The sample standard deviation is 0.6. Find the point estimate for the mean of all runners. Based on the results, what minimum speed should a runner obtain to qualify in a marathon at a 90% confidence level.

24
4. Ten randomly selected automobiles were stopped and the tread depth of the right front tire was measured. The mean was 0.32 in and the standard deviation was 0.08 in. Find the 95% confidence interval of the mean depth. Assume that the variable is approximately normally distributed.

25
5. The data below represent a sample of the number of home fires started by candles for the past seven years. Find the 99% confidence interval for the mean number of home fires started by candles each year. Assume the variable is normally distributed. 5460 590060906310 7160 84409930

26
Assignment: Practice Worksheet Confidence Intervals

Similar presentations


 (Small Samples)>")


>")


 6.2 Confidence Intervals for the Mean (Small.>")