Download presentation
Presentation is loading. Please wait.

3
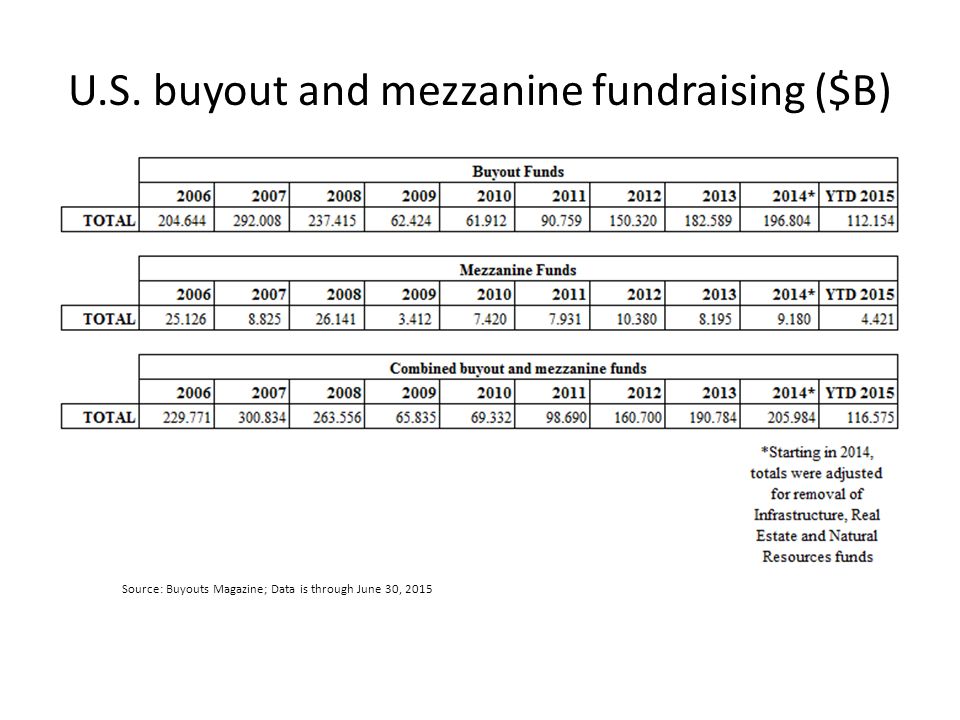
U.S. buyout and mezzanine fundraising ($B) Source: Buyouts Magazine; Data is through June 30, 2015
 Source: Buyouts Magazine; Data is through June 30, 2015")
4
U.S. buyout and mezzanine fundraising ($B) Source: Buyouts Magazine; Data is through June 30, 2015
 Source: Buyouts Magazine; Data is through June 30, 2015")
5
Quarterly breakdown of amount raised by U.S.- based buyout and mezzanine firms ($B) Source: Buyouts Magazine; Data is through June 30, 2015
 Source: Buyouts Magazine; Data is through June 30, 2015")
6
LBO funds raised by target size through Q2 2015 ($B) Source: Buyouts Magazine; Data is through June 30, 2015
 Source: Buyouts Magazine; Data is through June 30, 2015")
7
Amount raised in 2015 by fund type ($B) Source: Buyouts Magazine; Data is through June 30, 2015
 Source: Buyouts Magazine; Data is through June 30, 2015")
8
Largest fundraisers in 2015 YTD Source: Buyouts Magazine; Data is through June 30, 2015

9
Q2 2015 Playbook for Select LPs

10
2006-2015 pending and closed deal number and disclosed deal volume Source: Buyouts Magazine; Data is through June 17, 2015

11
U.S.-based disclosed deal value for closed deals by quarter ($B) Source: Buyouts Magazine; Data is through June 17, 2015
 Source: Buyouts Magazine; Data is through June 17, 2015")
12
Q2 2015 deals by type Source: Thomson Reuters, Buyouts, April 1 to June 17, 2015; the percentages reflect share of Q2 count of 355 closed deals; percentages add to more than 100% since a deal can appear in more than one category. We define standalone buyouts as deals that are not either carve-outs or take-privates.

13
Q2 2015 deals by industry Source: Thomson Reuters, Buyouts April 1 to June 17, 2015

14
Top 10 U.S. sponsor deals closed in Q2 2015

15
10 largest announced and pending deals by U.S. Sponsors, Q2 2015

16
The most active LBO dealmakers of Q2 2015 Below is a list of the most active LBO deal makers in the second quarter, based on number of closed transactions from April 1, 2015 to June 17, 2015. The numbers reflect platform deals, which could include standard LBOs, carve-outs, sponsor-to-sponsor deals, and take- privates. Add-on acquisitions by existing portfolio companies are also included. Note: The top 10 dealmakers took part in 78 of the 355 closed deals in Q2 through June 17, 2015 Source: Thomson Reuters Data, Buyouts

17
Buyout M&A Exits By Quarter Source: Thomson Reuters, 2010 through June 30, 2015

18
Q2 2015 M&A Exits Industry Breakdown Source: Thomson Reuters. Data is from April 1 to June 30.

19
PE-Backed IPO Exits By Quarter Source: Thomson Reuters, 2011 through June 30, 2015

Similar presentations


 refers to the aspect of corporate strategy, corporate finance and management dealing.>")


