Download presentation
Presentation is loading. Please wait.

1
Residual Properties Team Members: Sergio Luna Ain Lockman Kimberly Cagle Harisimran Jakhar

2
Definition A residual property is the difference between the actual and the ideal value of an extensive thermodynamic property at the same temperature and pressure

3
General Formula M R = M – M ig Where M is the molar value of the property (e.g.: V,U,H,S or G)
")
4
Explanation A residual Property acts as a correction for the ideal equations for H ig and S ig. In other words we can use the residual properties to get the actual enthalpy and entropy of a vapor.

5
Residuals for Liquids Residual properties are not useful for liquids because of the large enthalpy and entropy changes of vaporization that would have to be included in H R and S R. Instead of calculating H and S, we use the equations

6
Residual Enthalpy and Entropy (6.46) (6.48)
 (6.48)")
7
Compressibility Factor Z May be calculated from experimental PVT data. Equations 6.46 and 6.48 would be evaluated by numerical or graphical methods. These equations may be evaluated analytically if Z is expressed as a function of T and P by a volume- explicit equation of state.

8
Enthalpy and Entropy From Residual Properties Substitute ideal gas equations into the top equation

9
Enthalpy and Entropy From Residual Properties (cont’d) Chapter 4 Chapter 5 Recall…. Substitution yields…

10
This example was taken from the book

11
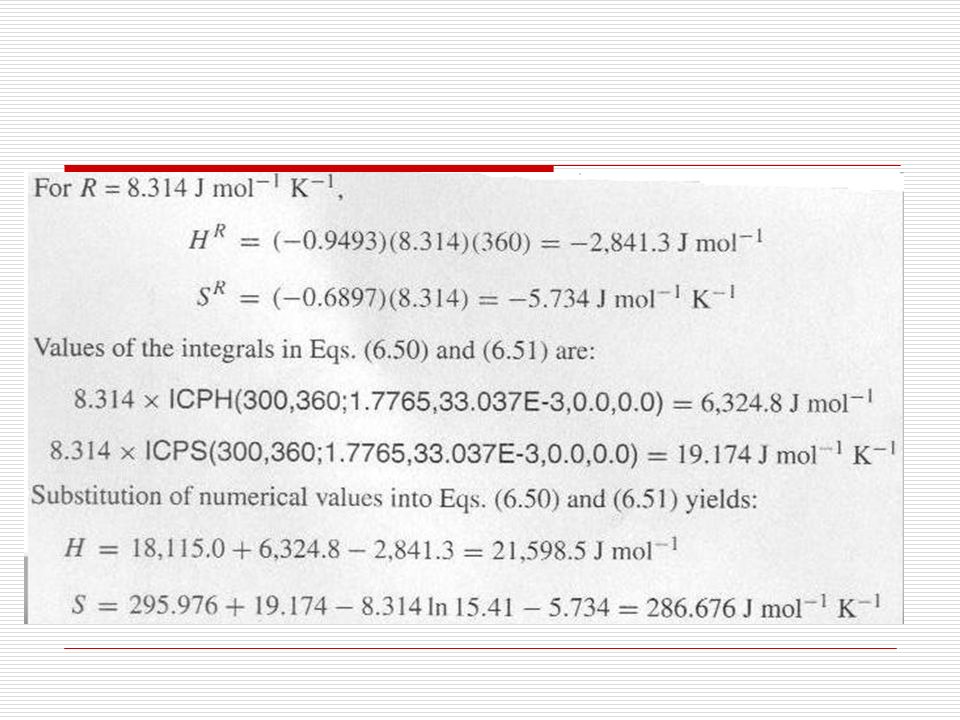
Calculation of H R and S R at 360K and 15.41 bar by application of Eqs. (6.46) and (6.48) requires evaluation of two integrals:
 and (6.48) requires evaluation of two integrals:.")
12
Graphical integration requires simple plots of Values of (z-1)/P are found from the compressibility factor data at 360 K The quantity for (∂Z/∂T) P /P requires evaluation of partial derivative (∂Z/∂T) P given by the plot of Z vs T at constant pressure.
/P are found from the compressibility factor data at 360 K The quantity for (∂Z/∂T) P /P requires evaluation of partial derivative (∂Z/∂T) P given by the plot of Z vs T at constant pressure.")
13
For this purpose separate plots are made of Z vs T for each pressure at which compressibility factor data are given and a slope is determined at 360 K for each curve ( this can be done by taking a tangent line at 360 k). Data gathered from this is shown below.

Similar presentations


 1. 2 Objectives Develop rules for determining nonreacting gas mixture properties from knowledge of mixture.>")
 becomes: (2.1) This equation may be applied to a single-phase fluid in a closed system wherein no.>")


 A closed system is one that does not exchange matter with its surroundings, although it may exchange energy. dn i = 0(i = 1, 2, …..)(1.1)>")


 i can correspond to either P or V.>")


 Ji-Sheng Chang>")
