Download presentation
Presentation is loading. Please wait.

1
ATMOSPHERIC AEROSOLS: ensembles of condensed-phase particles suspended in air Typical aerosol size distribution number area volume Aerosols are the visible part of the atmosphere: Pollution off U.S. east coast Dust off West AfricaCalifornia fire plumes

2
ORIGIN OF THE ATMOSPHERIC AEROSOL Soil dust Sea salt Size range: 0.001 m (molecular cluster) to 100 m (small raindrop)
 to 100 m (small raindrop)")
3
WHY CARE ABOUT ATMOSPHERIC AEROSOLS? Public health Visibility Ocean fertilization Chemistry Climate forcing Cloud formation

4
OZONE AND PARTICULATE MATTER (PM): THE TOP TWO AIR POLLUTANTS IN THE U.S. # millions of people living in areas exceeding national ambient air quality standards (NAAQS) in 2007 15 g m -3 (day), 65 (annual) 75 ppb (8-h average) 15 g m -3 (day), 65 (annual)
 in g m -3 (day), 65 (annual) 75 ppb (8-h average) 15 g m -3 (day), 65 (annual).")
5
ANNUAL MEAN PM 2.5 CONCENTRATIONS (2002) derived from MODIS satellite instrument data
 derived from MODIS satellite instrument data")
6
VISIBILITY IN U.S. WILDERNESS AREAS Statistics for 20% worst visibility days Deciviews 2001 observationsNatural Background; includes transboundary pollution 300 150 80 40 20 Visual range (km) Park et al. [2006] EPA Regional Haze Rule requires that natural visibility be achieved in all US wilderness areas by 2064
 Park et al. [2006] EPA Regional Haze Rule requires that natural visibility be achieved in all US wilderness areas by")
7
FINE AEROSOL COMPOSITION IN NORTH AMERICA Annual mean PM 2.5 concentrations (NARSTO, 2004) Current air quality standard is 15 g m -3
 Current air quality standard is 15 g m -3")
8
U.S. SO 2 EMISSIONS Sulfur emissions, Tg a -1 788.3 GLOBAL UNITED STATES

9
OBSERVED TITRATION OF SO 2 BY H 2 O 2 IN CLOUD First aircraft observations by Daum et al. [1984]
![OBSERVED TITRATION OF SO 2 BY H 2 O 2 IN CLOUD First aircraft observations by Daum et al. [1984]](http://images.slideplayer.com/32/10081603/slides/slide_9.jpg "OBSERVED TITRATION OF SO 2 BY H 2 O 2 IN CLOUD First aircraft observations by Daum et al. [1984]")
10
GLOBAL SULFUR BUDGET [Chin et al., 1996] (flux terms in Tg S yr -1 ) Phytoplankton (CH 3 ) 2 S SO 2 1.3d (DMS) 1.0d OHNO 3 Volcanoes Combustion Smelters SO4 2- 3.9d 22 10 64 OH cloud 42 818 4 dep 27 dry 20 wet dep 6 dry 44 wet H 2 SO 4 (g)
![GLOBAL SULFUR BUDGET [Chin et al., 1996] (flux terms in Tg S yr -1 ) Phytoplankton (CH 3 ) 2 S SO 2 1.3d (DMS) 1.0d OHNO 3 Volcanoes Combustion Smelters SO4 2- 3.9d OH cloud dep 27 dry 20 wet dep 6 dry 44 wet H 2 SO 4 (g)](http://images.slideplayer.com/32/10081603/slides/slide_10.jpg "GLOBAL SULFUR BUDGET [Chin et al., 1996] (flux terms in Tg S yr -1 ) Phytoplankton (CH 3 ) 2 S SO 2 1.3d (DMS) 1.0d OHNO 3 Volcanoes Combustion Smelters SO4 2- 3.9d OH cloud dep 27 dry 20 wet dep 6 dry 44 wet H 2 SO 4 (g)")
11
FORMATION OF SULFATE-NITRATE-AMMONIUM AEROSOLS Sulfate always forms an aqueous aerosol Ammonia dissolves in the sulfate aerosol totally or until titration of acidity, whichever happens first Nitrate is taken up by aerosol if (and only if) excess NH 3 is available after sulfate titration HNO 3 and excess NH 3 can also form a solid aerosol if RH is low Thermodynamic rules: Highest concentrations in industrial Midwest (coal-fired power plants) Conditionaerosol pHLow RHHigh RH [S(VI)] > 2[N(-III)]acidH 2 SO 4 nH 2 O, NH 4 HSO 4, (NH 4 ) 2 SO 4 (NH 4 +, H +, SO 4 2- ) solution [S(VI)] ≤ 2[N(-III)]neutral(NH 4 ) 2 SO 4, NH 4 NO 3 (NH 4 +,NO 3 - ) solution
![FORMATION OF SULFATE-NITRATE-AMMONIUM AEROSOLS Sulfate always forms an aqueous aerosol Ammonia dissolves in the sulfate aerosol totally or until titration of acidity, whichever happens first Nitrate is taken up by aerosol if (and only if) excess NH 3 is available after sulfate titration HNO 3 and excess NH 3 can also form a solid aerosol if RH is low Thermodynamic rules: Highest concentrations in industrial Midwest (coal-fired power plants) Conditionaerosol pHLow RHHigh RH [S(VI)] > 2[N(-III)]acidH 2 SO 4 nH 2 O, NH 4 HSO 4, (NH 4 ) 2 SO 4 (NH 4 +, H +, SO 4 2- ) solution [S(VI)] ≤ 2[N(-III)]neutral(NH 4 ) 2 SO 4, NH 4 NO 3 (NH 4 +,NO 3 - ) solution](http://images.slideplayer.com/32/10081603/slides/slide_11.jpg "FORMATION OF SULFATE-NITRATE-AMMONIUM AEROSOLS Sulfate always forms an aqueous aerosol Ammonia dissolves in the sulfate aerosol totally or until titration of acidity, whichever happens first Nitrate is taken up by aerosol if (and only if) excess NH 3 is available after sulfate titration HNO 3 and excess NH 3 can also form a solid aerosol if RH is low Thermodynamic rules: Highest concentrations in industrial Midwest (coal-fired power plants) Conditionaerosol pHLow RHHigh RH [S(VI)] > 2[N(-III)]acidH 2 SO 4 nH 2 O, NH 4 HSO 4, (NH 4 ) 2 SO 4 (NH 4 +, H +, SO 4 2- ) solution [S(VI)] ≤ 2[N(-III)]neutral(NH 4 ) 2 SO 4, NH 4 NO 3 (NH 4 +,NO 3 - ) solution")
12
RAOULT’S LAW water saturation vapor pressure over pure liquid water surface water saturation vapor pressure over aqueous solution of water mixing ratio x H2O An atmosphere of relative humidity RH can contain at equilibrium aqueous solution particles of water mixing ratio

13
AMMONIA EMISSIONS Ammonia, Tg N a -1 GLOBAL UNITED STATES 55 2.8

14
SULFATE-NITRATE-AMMONIUM AEROSOLS IN U.S. (2001) Highest concentrations in industrial Midwest (coal-fired power plants) SulfateNitrate Ammonium Acidity
 Highest concentrations in industrial Midwest (coal-fired power plants) SulfateNitrate Ammonium Acidity.")
15
QUESTIONS 1.Aqueous-phase oxidation of SO 2 by ozone SO 3 2- + O 3 (aq) → SO 4 2- + O 2 produces acidity even though H + is not directly involved. Explain why. 2. Aqueous-phase oxidation of SO 2 by H 2 O 2 is acid-catalyzed and this is critical for the importance of this reaction as a source of sulfate. Explain why. 3. Aerosol nitrate concentrations peak in winter. Explain why. 4. Aerosol nitrate is usually more sensitive to ammonia emissions than aerosol ammonium. Explain why. 5. It has been argued that decreasing SO 2 emissions to decrease aerosol sulfate could result in an increase in aerosol nitrate, increasing in fact the total PM 2.5 mass concentration. Explain why.

16
FINE AEROSOL COMPOSITION IN NORTH AMERICA Annual mean PM 2.5 concentrations (NARSTO, 2004) Current air quality standard is 15 g m -3
 Current air quality standard is 15 g m -3")
17
WORLDWIDE MEASUREMENTS OF FINE AEROSOL COMPOSITION

18
CARBONACEOUS AEROSOL SOURCES IN THE U.S. ORGANIC CARBON (OC) 2.7 Tg yr -1 BLACK CARBON (BC) 0.66 Tg yr -1 Annual mean concentrations (2001) BC OC
 2.7 Tg yr -1 BLACK CARBON (BC) 0.66 Tg yr -1 Annual mean concentrations (2001) BC OC.")
19
RADIATIVE FORCING FROM BLACK CARBON (BC) IPCC [2007]
![RADIATIVE FORCING FROM BLACK CARBON (BC) IPCC [2007]](http://images.slideplayer.com/32/10081603/slides/slide_19.jpg "RADIATIVE FORCING FROM BLACK CARBON (BC) IPCC [2007]")
20
BC is emitted by incomplete combustion “BC” or “soot” is optically defined and includes both graphitic elemental carbon (EC) and light-absorbing heavy organic matter Diesel engines are large BC sources Freshly emitted BC particle
 and light-absorbing heavy organic matter Diesel engines are large BC sources Freshly emitted BC particle")
21
Atmospheric aging and scavenging of BC Emission Hydrophobic BC resistant to scavenging coagulation gas condensation Hydrophilic BC coated with sulfate, nitrate Scavenging Aging time scale τ ~ 1 d Implications for BC export from source continents: OCEAN aging scavenging Hydrophobic BC aging long-range transport FREE TROPOSPHERE BOUNDARY LAYER

22
LONG-RANGE TRANSPORT OF BC TO THE ARCTIC (ARCTAS aircraft campaign, April 2008) Altitude, km BC, ng m -3 STP mg m -2 month -1 Arctic vertical profiles BC sources Qiaoqiao Wang, Harvard
 Altitude, km BC, ng m -3 STP mg m -2 month -1 Arctic vertical profiles BC sources Qiaoqiao Wang, Harvard")
23
FRONTAL LIFTING IN WARM CONVEYOR BELTS Boundary layer post-frontal flow WCB lifting

24
ORGANIC AEROSOL IN STANDARD GEOS-Chem MODEL fuel/industry open fires OH, O 3,NO 3 SOGSOA POA K vegetation fuel/industry open fires 700 isoprene terpenes oxygenates… 30 alkenes aromatics oxygenates… alkanes alkenes aromatics… VOC EMISSIONPRIMARY EMISSION VOC 50 20100 20 Global sources in Tg C y -1 secondary formation

25
TERPENES Terpenes are biogenic hydrocarbons produced in plants by combination of isoprene units (C 5 H 8 ) Monoterpenes: C 10 H 16 β-pinene Sesquiterpenes: C 15 H 24 δ-cadinene
 Monoterpenes: C 10 H 16 β-pinene Sesquiterpenes: C 15 H 24 δ-cadinene")
26
SOA MODELING AS GAS-AEROSOL EQUILIBRIUM VOC oxidation generates semi-volatile products: …which then partition between the gas and aerosol phase: where the partitioning coefficient is given by …and is a strong function of temperature. Values of and p 0 are fitted to smog chamber data Chung and Seinfeld, 2002 M o is the mass concentration of pre-existing organic aerosol

27
OBSERVED SOA FORMATION IN MEXICO CITY …cannot be explained by standard gas-aerosol equilibrium model Volkamer et al., 2006

28
MODEL BIAS WORSENS AS AIR AGES Volkamer et al., 2006

29
ITCT-2K4 AIRCRAFT CAMPAIGN OVER EASTERN U.S. IN JULY-AUGUST 2004 water-soluble organic carbon (WSOC) aerosol measurements by Rodney J. Weber (Georgia Tech) 2-6 km altitude Alaska fire plumes Values ~2x lower than observed in ACE-Asia; excluding fire plumes gives mean of 1.0 gC m -3 (3x lower than ACE-Asia) Heald et al. [JGR 2006b]
 aerosol measurements by Rodney J. Weber (Georgia Tech) 2-6 km altitude Alaska fire plumes Values ~2x lower than observed in ACE-Asia; excluding fire plumes gives mean of 1.0 gC m -3 (3x lower than ACE-Asia) Heald et al. [JGR 2006b].")
30
MODEL OC AEROSOL SOURCES DURING ITCT-2K4 ~10% yield~2% yield Large fires in Alaska and NW Canada: 60% of fire emissions released above 2 km (pyro-convection) Heald et al., [JGR 2006b]
![MODEL OC AEROSOL SOURCES DURING ITCT-2K4 ~10% yield~2% yield Large fires in Alaska and NW Canada: 60% of fire emissions released above 2 km (pyro-convection) Heald et al., [JGR 2006b]](http://images.slideplayer.com/32/10081603/slides/slide_30.jpg "MODEL OC AEROSOL SOURCES DURING ITCT-2K4 ~10% yield~2% yield Large fires in Alaska and NW Canada: 60% of fire emissions released above 2 km (pyro-convection) Heald et al., [JGR 2006b]")
31
ITCT-2K4 OC AEROSOL: VERTICAL PROFILES SO x = SO 2 + SO 4 2- : efficient scavenging during boundary layer ventilation Observations Model hydro- phobic Data filtered against fire plumes (solid) and unfiltered (dotted) Model source attribution Total Biomass burning Anthropogenic Biogenic SOA Heald et al. [JGR 2006b]

32
IRREVERSIBLE DICARBONYL UPTAKE BY AQUEOUS AEROSOL Chamber experiments of glyoxal uptake by Liggio et al. [JGR 2005] Organic aerosol mass growth with time Inferred reactive uptake coefficient median = 2.9x10 -3 observed for aqueous surfaces; evidence for oligomerization similar observed for methylglyoxal on acidic surfaces [Zhao et al. ES&T 2006] glyoxalmethylglyoxal

33
POSSIBLE MECHANISMS FOR DICARBONYL SOA FORMATION GASAQUEOUS Oligomers OH Organic acids H* ~ 10 5 M atm -1 Ervens et al. [2004] Crahan et al. [2004] Lim et al. [2005] Carlton et al. [2006, 2007] Warneck et al. [2005] Sorooshian et al. [2006, 2007] Altieri et al. [2006, 2008] Schweitzer et al. [1998] Kalberer et al. [2004] Liggio et al. [2005a,b] Hastings et al. [2005] Zhao et al. [2006] Loeffler et al. [2006] glyoxal H* ~ 10 3 M atm -1 methylglyoxal oxidation oligomerization

34
GLYOXAL/METHYLGLYOXAL FORMATION FROM ISOPRENE GEOS-Chem mechanism based on MCM v3.1 Fu et al. [JGR, 2008] 6%25% molar yields

35
ICARTT AIRCRAFT DATA OVER EASTERN U.S. (Jul-Aug 2004) Mean vertical profile of water-soluble organic carbon (WSOC) aerosol Observed (Weber) Model w/ dicarbonyl SOA added Model w/ standard SOA Correlation with other variables measured from aircraft (grey = obs, colors = model) Fu et al. [AE, 2009] includes SOA from irreversible cloud uptake of glyoxal & methylglyoxal
 Mean vertical profile of water-soluble organic carbon (WSOC) aerosol Observed (Weber) Model w/ dicarbonyl SOA added Model w/ standard SOA Correlation with other variables measured from aircraft (grey = obs, colors = model) Fu et al. [AE, 2009] includes SOA from irreversible cloud uptake of glyoxal & methylglyoxal.")
36
SOA MODELING USING VOLATILITY BASIS SETS Partition semi-volatile VOCs between aerosol and gas: Aerosol fraction for SVOC i Define SVOCs by their stability class: Donahue et al. [2006]

37
SOA VOLATILITY BASIS SET: EFFECT OF DILUTION Donahue et al. [2006]
![SOA VOLATILITY BASIS SET: EFFECT OF DILUTION Donahue et al. [2006]](http://images.slideplayer.com/32/10081603/slides/slide_37.jpg "SOA VOLATILITY BASIS SET: EFFECT OF DILUTION Donahue et al. [2006]")
38
SOA VOLATILITY BASIS SET: CHEMICAL AGING Donahue et al. [2006] As VOCs go through successive oxidation steps, products become more oxygenated and less volatile, but eventually smaller and more volatile

39
IMPLEMENTING OC VOLATILITY CLASSES IN GEOS-Chem Pye and Seinfeld [2010] Combustion “Primary” OC is actually semi-volatile Mean wintertime OC concentrations: IMPROVE data shown as circles
![IMPLEMENTING OC VOLATILITY CLASSES IN GEOS-Chem Pye and Seinfeld [2010] Combustion Primary OC is actually semi-volatile Mean wintertime OC concentrations: IMPROVE data shown as circles](http://images.slideplayer.com/32/10081603/slides/slide_39.jpg "IMPLEMENTING OC VOLATILITY CLASSES IN GEOS-Chem Pye and Seinfeld [2010] Combustion Primary OC is actually semi-volatile Mean wintertime OC concentrations: IMPROVE data shown as circles")
40
QUESTIONS 1.Formation of “biogenic SOA” from isoprene and terpenes is thought to increase in the presence of anthropogenic aerosol. Explain why. 2.Observations show bursts of SOA formation following cloud processing of an air parcel. Explain how this might take place.

41
GENERAL SCHEMATIC FOR HETEROGENEOUS CHEMISTRY A(g)A(g) s A(aq) s A(aq) B(aq) BsBs B(g) diffusion surface reaction aqueous reaction GAS AEROSOL Aerosols enable surface and ionic reactions that would not happen in the gas phase; also concentrate low-volatility species in condensed phase interfacial equilibrium
A(g) s A(aq) s A(aq) B(aq) BsBs B(g) diffusion surface reaction aqueous reaction GAS AEROSOL Aerosols enable surface and ionic reactions that would not happen in the gas phase; also concentrate low-volatility species in condensed phase interfacial equilibrium")
42
FLUX AT THE GAS-PARTICLE INTERFACE A(g)A(g) s A(aq) s diffusion interfacial equilibrium l = mean free path of air (0.18 m at STP) a = particle radius Knudsen number Kn = a/l Kn >>1: continuum (diffusion-limited) regime Kn<<1: free molecular (collision-limited) regime n bulk GAS PARTICLE n(aq) s a r 0 distance from center of particle
A(g) s A(aq) s diffusion interfacial equilibrium l = mean free path of air (0.18 m at STP) a = particle radius Knudsen number Kn = a/l Kn >>1: continuum (diffusion-limited) regime Kn<<1: free molecular (collision-limited) regime n bulk GAS PARTICLE n(aq) s a r 0 distance from center of particle")
43
SOLUTION FOR THE CONTINUUM REGIME n bulk GAS PARTICLE n(aq) s a r Continuity equation: D = molecular diffusion coefficient in gas phase K H = Henry’s law equilibrium constant In spherical coordinates, Solve for the transfer flux at gas-particle interface:
 s a r Continuity equation: D = molecular diffusion coefficient in gas phase K H = Henry’s law equilibrium constant In spherical coordinates, Solve for the transfer flux at gas-particle interface:")
44
SOLUTION FOR THE FREE MOLECULAR REGIME Collision flux with surface from random motion of molecules: where v is the mean molecular speed. Only a fraction (mass accommodation coefficient) of collisions results in bulk uptake by the particle, so the uptake flux is
 of collisions results in bulk uptake by the particle, so the uptake flux is.")
45
APPROXIMATE SOLUTION FOR TRANSITION REGIME: where A is the aerosol surface area per unit volume of air (cm 2 cm -3 ), and k is a first-order gas-particle transfer rate constant:
, and k is a first-order gas-particle transfer rate constant:")
46
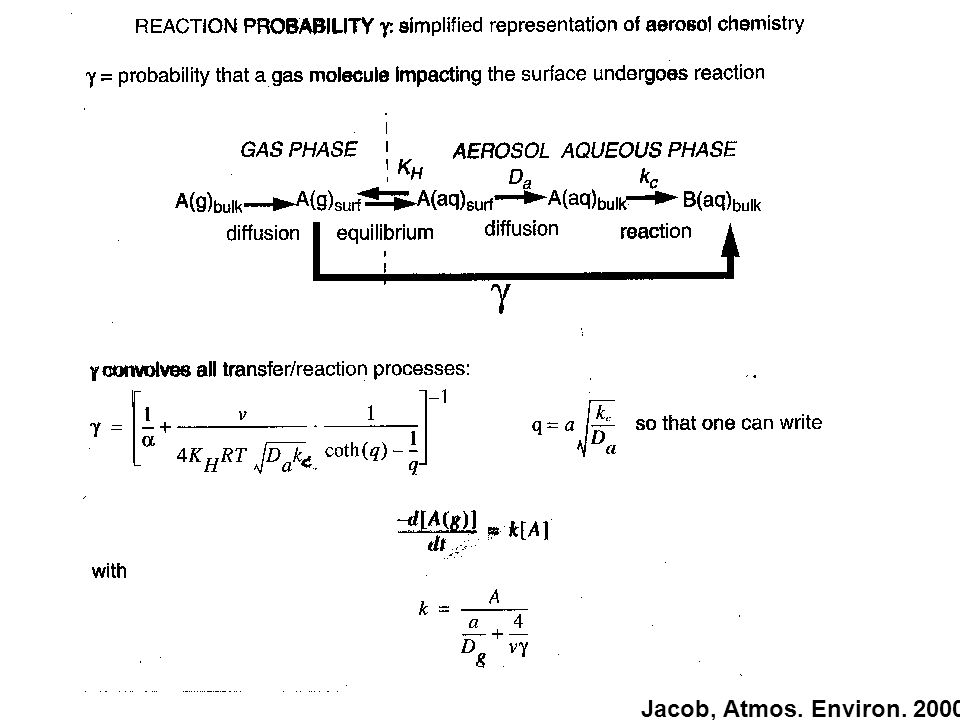
TIME SCALES FOR GAS-PARTICLE TRANSFER A(g)A(g) s A(aq) s A(aq) B(aq) diffusion chemical reaction (k c ) interfacial equilibrium mixing diff In cloud: OH HO 2 most others; bulk equilibrium O 3, NO 3 Jacob, Atmos. Environ. 2000

Similar presentations


, find what ozone levels would result if emissions of NO x were.>")

 Current air quality standard is 15 g m -3.>")


 into CMAQ Yang Zhang, Betty K. Pun, Krish Vijayaraghavan,>")
 in the Mexico City Metropolitan Area November 2, 2007 EAS Graduate Student Symposium Christopher.>")


 Edited by Ted Dibble (2008)>")
 Colette L. Heald NOAA Climate and Global Change Postdoctoral Fellow>")


 with T. Duncan Fairlie, Colette L. Heald,>")