Download presentation
Presentation is loading. Please wait.

3
1. Who takes the CLA at WSU? 2. Are participants representative? All Seniors Seniors with an ACT “Native” Seniors 3. What are the scores? 4. How do WSU students compare with other 4-year schools using the CLA?

4
ACT or SAT score: 51% of degree bound seniors have an ACT or SAT score Minimum number transfer hours Spring 2007: 1 -15 transfer hours with minimum 95 total earned hours Spring 2008 and spring 2009: ▪minimum 109 earned hours ▪Fewer than 22 transfer hours Willing to participate

5
CLA group is 2 years younger(24 vs. 26 years) than total pool Mean ACT composite scores are slightly higher for the CLA group (25 vs. 23) Mean total earned credit hours essentially equivalent(129 vs. 132) Mean transfer hours higher in CLA group compared to total pool(11 vs. 7) Participation by gender, residency, ethnicity/race was not statistically different.
 than total pool Mean ACT composite scores are slightly higher for the CLA group (25 vs. 23) Mean total earned credit hours essentially equivalent(129 vs. 132) Mean transfer hours higher in CLA group compared to total pool(11 vs. 7) Participation by gender, residency, ethnicity/race was not statistically different..")
6
Participants by College All Degree-bound Seniors with >108 earned hours & < 22 transfer hours N%N% BA4820%31219% ED208%21613% EN4418%15510% FA2310%22013% HP2410%1318% LAS8033%59737% Total239100% 1,631100%

7
Results from three administrations of the CLA to seniors

8
There were no differences among scores for the three administrations There were no differences in relative performance scores for the three administrations. There were no differences in percentile rankings Thus three years of data are pooled.

9
NMean(SD)RangeACT Range Mean ACT 2391,145 (160.9)620 -1,47013 - 3325
RangeACT Range Mean ACT 2391,145 (160.9)620 -1,")
10
NMean(SD)RangeACT Equivalent (Mean) Performance Task 1181,278 (203.6)762 – 1,790 15-16 to +36 28-29 Analytical Reasoning 1191,270 (150.8)898 – 1,732 18-19 to +36 28 -29 Make an Argument 1191,254 (171.2)847 – 1,742 17-18 to +36 27 -28 Critique an Argument 1201,281 (186.9)766 – 1,815 15-16 to +36 28- 29
RangeACT Equivalent (Mean) Performance Task 1181,278 (203.6)762 – 1, to Analytical Reasoning 1191,270 (150.8)898 – 1, to Make an Argument 1191,254 (171.2)847 – 1, to Critique an Argument 1201,281 (186.9)766 – 1, to")
11
Below Expected ExpectedAbove Expected Performance Task 22%23%55% Analytical Reasoning 35%17%48% Make an Argument 36%18%46% Critique an Argument 33%21%46%

14
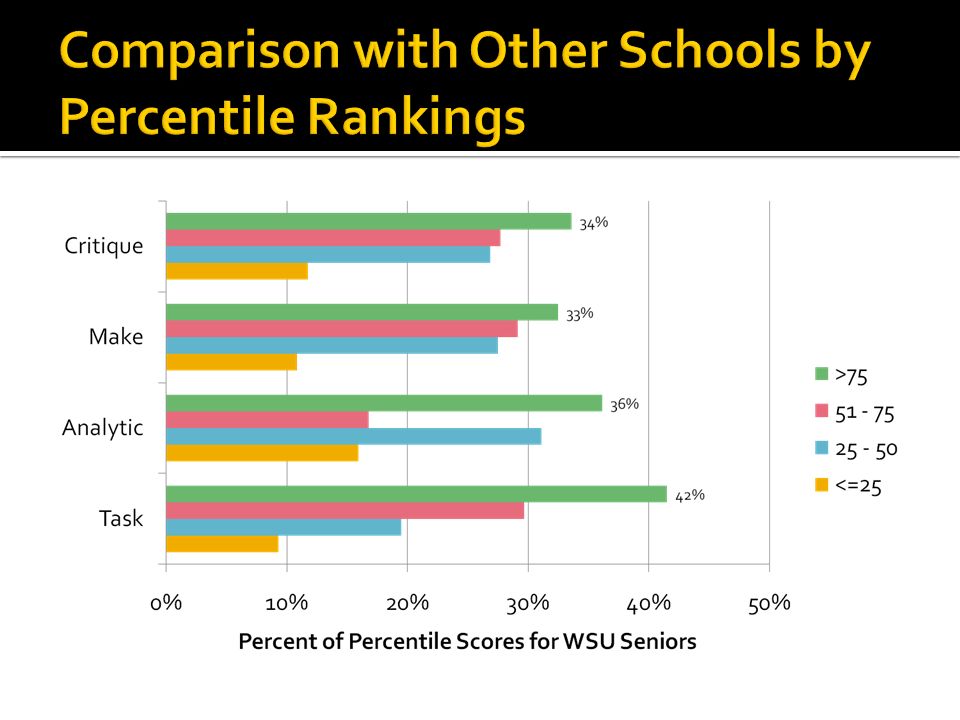
TaskMean Score Unadjusted Percentile Rank Performance Task 1,27985.5 Analytical Reasoning 1,27064.5 Make Argument 1,25462.0 Critique Argument 1,28163.0

15
Below Expected ExpectedAbove Expected Performance Task 30%26%44% Analytical Reasoning 32%22%46% Make an Argument 41%22%37% Critique an Argument 27%29%44%

Similar presentations