Download presentation
Presentation is loading. Please wait.

1
Ten Year average of SeaWIFS ocean color data (1997-2007) (NASA/MODIS ocean color http://oceancolor.gsfc.nasa.gov NORTHEAST PACIFIC CARBON PROGRAM Investigating the mechanisms responsible for massive CO 2 drawdown at the subarctic-subtropical gyre Steven Emerson, Paul Quay, Charlie Eriksen, Ricardo Letelier Carbocean, Dec, 2008
 (NASA/MODIS ocean color NORTHEAST PACIFIC CARBON PROGRAM Investigating the mechanisms responsible for massive CO 2 drawdown at the subarctic-subtropical gyre Steven Emerson, Paul Quay, Charlie Eriksen, Ricardo Letelier Carbocean, Dec, 2008")
2
Ten Year average of SeaWIFS ocean color data (1997-2007) (NASA/MODIS ocean color http://oceancolor.gsfc.nasa.gov IN SITU MEASUREMENTS OF NET BIOLOGICAL OXYGEN PRODUCTION COLLABORATORS: Roo Nicholson, Charlie Eriksen, Chuck Stump U.W. Meghan Cronin,Chris Sabine, PMEL Mike DeGranpre, U.Montana; Marie Robert IOS, BC, CA Tommy Dickey, HOT Scientists

3
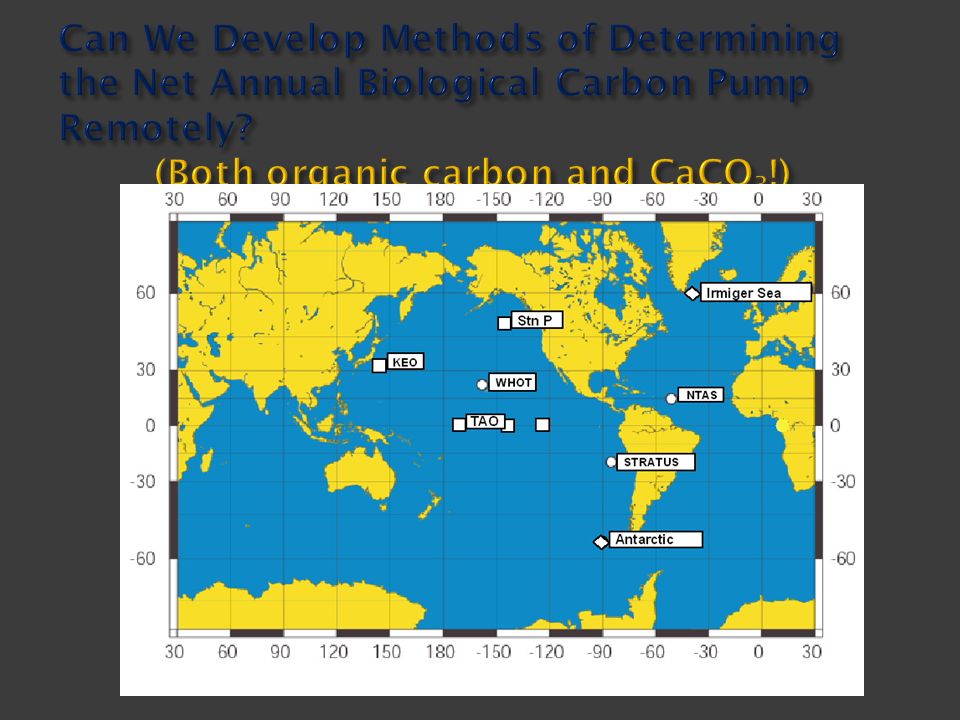
X X X X GOAL To Determine the Value of Oxygen and Carbon Export form the Ocean Euphotic Zone and the Processes Controlling it (Laws, 2000, GBC, 14, 1231) (Schlitzer, 2000, Geophys. Mono. 114)
.")
4
d[C]/dt = diffusive gas exchange + bubble exchange + diapycnal mixing + isopycnal mixing + biological production
![d[C]/dt = diffusive gas exchange + bubble exchange + diapycnal mixing + isopycnal mixing + biological production](http://images.slideplayer.com/32/10072008/slides/slide_4.jpg "d[C]/dt = diffusive gas exchange + bubble exchange + diapycnal mixing + isopycnal mixing + biological production")
5
Sensors: CTD-O 2 -GTD, 10 m Sensors: CTD-O 2 -GTD, pCO 2, pH The MOSEAN Mooring and Seaglider The Hawaii Ocean Time Series (HOT) 2005-2006 The UW-PMEL Mooring and Seaglider at Stn P (2007 - ) STUDY LOCATIONS AND METHODS
 The UW-PMEL Mooring and Seaglider at Stn P ( ) STUDY LOCATIONS AND METHODS")
6
HOT Stn P atmosphere GTD Atmosphere &Total Dissolved Gas Pressures in the surface Ocean at HOT & Stn P

7
HOT Stn P Pressure of N 2 (p N2 ) is determined from atmospheric and total dissolved gas pressure, and [O 2 ] p N2 = P W,GTD – (P Atm -p H2O )(X Ar +X CO2 ) – p H2O – [O 2 ]/K H,O2
![HOT Stn P Pressure of N 2 (p N2 ) is determined from atmospheric and total dissolved gas pressure, and [O 2 ] p N2 = P W,GTD – (P Atm -p H2O )(X Ar +X CO2 ) – p H2O – [O 2 ]/K H,O2](http://images.slideplayer.com/32/10072008/slides/slide_7.jpg "HOT Stn P Pressure of N 2 (p N2 ) is determined from atmospheric and total dissolved gas pressure, and [O 2 ] p N2 = P W,GTD – (P Atm -p H2O )(X Ar +X CO2 ) – p H2O – [O 2 ]/K H,O2")
8
G = mass transfer coefficient (Wind Speed) V = Bubble transfer coefficients (Wind Speed) V = Bubble transfer coefficients h = mixed layer depth D= molecular diffusion coef. α = solubility X = atmospheric mole fraction Assume: Vinj= VexD α F pyc = 0 Assume: Vinj= VexD α F pyc = 0 Use N 2 to determine V Use N 2 to determine V O 2 to determine J O 2 to determine J Calculation of Net O 2 production from O 2 and N 2 data h(d[O 2 ]/dt) = -F air-water + dh/dz ([O 2,therm –[O 2 ]) + F pyc + J bio F a-w = Diffusive Exchange + Bubble Transfer F a-w = G{[O 2,sat ] – [O 2 ]} + (V inj + V ex D 0.5 α}X O2 h(d[O 2 ]/dt) = -F air-water + dh/dz ([O 2,therm –[O 2 ]) + F pyc + J bio F a-w = Diffusive Exchange + Bubble Transfer F a-w = G{[O 2,sat ] – [O 2 ]} + (V inj + V ex D 0.5 α}X O2
 = -F air-water + dh/dz ([O 2,therm –[O 2 ]) + F pyc + J bio F a-w = Diffusive Exchange + Bubble Transfer F a-w = G{[O 2,sat ] – [O 2 ]} + (V inj + V ex D 0.5 α}X O2 h(d[O 2 ]/dt) = -F air-water + dh/dz ([O 2,therm –[O 2 ]) + F pyc + J bio F a-w = Diffusive Exchange + Bubble Transfer F a-w = G{[O 2,sat ] – [O 2 ]} + (V inj + V ex D 0.5 α}X O2.")
9
Cumulative O 2 Production at HOT the important terms in the mass balance Mixed-layer O 2 Production = 4.8 ± 2.7 mol m -2 yr -1 (Emerson et al., 2008, GBC)
")
10
Oxygen Productivity below the Mixed Layer: T, S, and Oxygen concentration on Sea Glider (Nicholson, Emerson, Eriksen, 2008, L&O 53, 2226 ) NENE NWNW SWSW SESE X Aloha Correlation among: SSH, isopycnal depth, [O 2 ] Glider path and mean O 2 superaturation NCP (below the m. l.) =0.9 mol C m -2 yr -1
![Oxygen Productivity below the Mixed Layer: T, S, and Oxygen concentration on Sea Glider (Nicholson, Emerson, Eriksen, 2008, L&O 53, 2226 ) NENE NWNW SWSW SESE X Aloha Correlation among: SSH, isopycnal depth, [O 2 ] Glider path and mean O 2 superaturation NCP (below the m.](http://images.slideplayer.com/32/10072008/slides/slide_10.jpg "l.) =0.9 mol C m -2 yr -1.")
11
Summary of Biological O 2 Production at HOT and Stn P: from mooring and glider measurements Mixed-layer O 2 Production = 4.8 ± 2.7 mol m -2 yr -1 (Emerson et al., 2008) Submixed layer Production = 0.9 ± 0.3 (Nicholson et al., 2008) Flux across the thermocline 0.0 – 0.8 mol m -2 yr -1 (K z = 0.1-1.0 cm 2 s -1 ) Biological O 2 Production = 6.1 ± 3.1 mol m -2 yr -1 HOT: Net Biological C Production = 4.2 mol C m -2 yr -1 STN P: Net Biological C Production = 2.3 mol C m -2 yr -1 HOT STA P
 Submixed layer Production = 0.9 ± 0.3 (Nicholson et al., 2008) Flux across the thermocline 0.0 – 0.8 mol m -2 yr -1 (K z = cm 2 s -1 ) Biological O 2 Production = 6.1 ± 3.1 mol m -2 yr -1 HOT: Net Biological C Production = 4.2 mol C m -2 yr -1 STN P: Net Biological C Production = 2.3 mol C m -2 yr -1 HOT STA P")
12
CONCLUSION: O 2 and Organic C export is at least as great at Hot as it is at Stn P – Satellite Export is uncalibrated! 2.3 4.2 mol C m -2 yr -1

13
pH and pCO 2 at Stn P pCO 2 Chris Sabine pH Steve Emerson and Mike deGranpre [CO 3 2- ] calculated pH = 8.10, pCO 2 = 400 ppm pH = 8.05, pCO 2 =350 ppm pCO 2 pH The Role of CaCO 3 and Organic Matter Production in DIC Change [CO 3 ] increases by ~25 mol kg -1 in summer
![pH and pCO 2 at Stn P pCO 2 Chris Sabine pH Steve Emerson and Mike deGranpre [CO 3 2- ] calculated pH = 8.10, pCO 2 = 400 ppm pH = 8.05, pCO 2 =350 ppm pCO 2 pH The Role of CaCO 3 and Organic Matter Production in DIC Change [CO 3 ] increases by ~25 mol kg -1 in summer](http://images.slideplayer.com/32/10072008/slides/slide_13.jpg "pH and pCO 2 at Stn P pCO 2 Chris Sabine pH Steve Emerson and Mike deGranpre [CO 3 2- ] calculated pH = 8.10, pCO 2 = 400 ppm pH = 8.05, pCO 2 =350 ppm pCO 2 pH The Role of CaCO 3 and Organic Matter Production in DIC Change [CO 3 ] increases by ~25 mol kg -1 in summer")
14
Calculating the fraction of the DIC Change that is due to CaCO 3 formation and O.M. formation (1) ΔDIC =ΔDIC(om) + ΔDIC(CaCO3) (2) ΔAlk = ΔAlk (om) + ΔAlk(CaCO 3 ) (3) ΔDIC(om) = ΔO 2 r DIC:O2 = ΔO 2 (-106/154) (4) ΔAlk(om) = ΔO 2 r Alk:O2 = ΔO 2 (16/154) (5) 2 ΔDIC(CaCO 3 ) = ΔAlk(CaCO 3 ) (6) ΔAlk - ΔDIC = 25 μmol kg -1 Combining these equations gives: ΔDIC (CaCO 3 ) / ΔDIC (om) = 1.4 (3) RESULTS: O 2 AND N 2 SUPERSATURATION IN THE MIXED LAYE R [CO 3 ] increases by ~25 mol kg -1 in summer
 ΔDIC =ΔDIC(om) + ΔDIC(CaCO3) (2) ΔAlk = ΔAlk (om) + ΔAlk(CaCO 3 ) (3) ΔDIC(om) = ΔO 2 r DIC:O2 = ΔO 2 (-106/154) (4) ΔAlk(om) = ΔO 2 r Alk:O2 = ΔO 2 (16/154) (5) 2 ΔDIC(CaCO 3 ) = ΔAlk(CaCO 3 ) (6) ΔAlk - ΔDIC = 25 μmol kg -1 Combining these equations gives: ΔDIC (CaCO 3 ) / ΔDIC (om) = 1.4 (3) RESULTS: O 2 AND N 2 SUPERSATURATION IN THE MIXED LAYE R [CO 3 ] increases by ~25 mol kg -1 in summer.")
15
CONCLUSIONS 1. It is possible to determine the major components of the carbon fluxes remotely using presently available in situ sensors 2. Net Oxygen (Organic Carbon) Production in the subtropical North Pacific is ≥ that in the subarctic Pacific which meaning that models and satellite color predictions are not yet correct. 3. Net Carbon Production HOT (subtropical) NCP = 4.2 mol C m -2 yr -1 Stn P (subarctic) NCP = 5.5 ncp (o.m.) = 2.3 ncp (CaCO 3 ) = 3.2
 Production in the subtropical North Pacific is ≥ that in the subarctic Pacific which meaning that models and satellite color predictions are not yet correct. 3. Net Carbon Production HOT (subtropical) NCP = 4.2 mol C m -2 yr -1 Stn P (subarctic) NCP = 5.5 ncp (o.m.) = 2.3 ncp (CaCO 3 ) = 3.2.")
16
THE FUTURE (A) A Global distribution of moorings and sensors
 A Global distribution of moorings and sensors")
17
THE CHALLENGE

20
Location Carbon Export (mol m -2 yr -1 ) Subtropical Pacific (HOT) 1.5 – 2.5 a Western Subarctic Pacific ~ 4.5 b Eastern Subarctic Pacific (Stn. P) 2.1 ± 1.1 c, 2.2 b Subtropical Atlantic (BATS) 4.0 ± 1.6 d E. Equatorial Pacific 4.4 ± 2.3 e a Emerson et al., 1997; Benetiz-Nelson et al., 2001;Quay & Stutzman, 2003; Hamme and Emerson, 2005 b NO 3 drawdown, Wong et al., 2002 c Emerson et al., 1991 d Spitzer and Jenkins, 1989 e Zhang and Quay, 1997 X X X X GLOBAL GOAL: To Understand the Importance of Biological Carbon Export in Determining the Ocean- Atmosphere Flux of CO 2 1 3 10 30 Net Carbon Export (mol C m -2 yr -1 ) Laws et al., 2000 X
 2.1 ± 1.1 c, 2.2 b Subtropical Atlantic (BATS) 4.0 ± 1.6 d E. Equatorial Pacific 4.4 ± 2.3 e a Emerson et al., 1997; Benetiz-Nelson et al., 2001;Quay & Stutzman, 2003; Hamme and Emerson, 2005 b NO 3 drawdown, Wong et al., 2002 c Emerson et al., 1991 d Spitzer and Jenkins, 1989 e Zhang and Quay, 1997 X X X X GLOBAL GOAL: To Understand the Importance of Biological Carbon Export in Determining the Ocean- Atmosphere Flux of CO Net Carbon Export (mol C m -2 yr -1 ) Laws et al., 2000 X.")
21
Models also predict more carbon export in upwelling areas and less in the open ocean (Schlitzer, 1999)Location Carbon Export (mol m -2 yr -1 ) Subtropical Pacific (HOT) 1.5 – 2.5 a Western Subarctic Pacific ~ 4.5 b Eastern Subarctic Pacific (Stn. P) 2.1 ± 1.1 c, 2.2 b Subtropical Atlantic (BATS) 4.0 ± 1.6 d E. Equatorial Pacific 4.4 ± 2.3 e a Emerson et al., 1997; Benetiz-Nelson et al., 2001;Quay & Stutzman, 2003; Hamme and Emerson, 2005 b NO 3 drawdown Wong et al., 2002 c Emerson et al., 1991 d Spitzer and Jenkins, 1989 e Zhang and Quay, 1997 X X X X X X X
 2.1 ± 1.1 c, 2.2 b Subtropical Atlantic (BATS) 4.0 ± 1.6 d E. Equatorial Pacific 4.4 ± 2.3 e a Emerson et al., 1997; Benetiz-Nelson et al., 2001;Quay & Stutzman, 2003; Hamme and Emerson, 2005 b NO 3 drawdown Wong et al., 2002 c Emerson et al., 1991 d Spitzer and Jenkins, 1989 e Zhang and Quay, 1997 X X X X X X X.")
Similar presentations


>")


 Christoph Heinze University of Bergen, Geophysical Institute and Bjerknes Centre for Climate Research Prof. in.>")


 Chris Sabine (NOAA/PMEL/JISAO)>")

