Download presentation
Presentation is loading. Please wait.

1
Quantitative MALDI-TOF for Clinical Applications

2
Outline TOF-MS for clinical applications and for research Why is MALDI-TOF not quantitative? How do we make it quantitative? Some example of quantitative MALDI.

3
Major advances for practical MALDI-TOF for quantitative and clinical applications Lasers Digital electronics Ion detectors Ion optics Delayed extraction/time lag focusing Motion control DAC control of electronics Software, software, software

4
Lasers Nitrogen 337 nm, 10-50 Hz 50-500 shots/spectrum large spot size short life (10 million shots) Solid State, tripled YAG/YLF 349 or 355 nm 1-10 kHz 1000-1,000,000 shots/spectrum small spot size (20-100 m) long life (100 billion shots) Digitizers TDC (time-digital convertor) <1 ion/channel/shot Transient Digitizer (digital oscilloscope) OLD NEW OLD NEW
 Solid State, tripled YAG/YLF 349 or 355 nm 1-10 kHz ,000,000 shots/spectrum small spot size ( m) long life (100 billion shots) Digitizers TDC (time-digital convertor) <1 ion/channel/shot Transient Digitizer (digital oscilloscope) OLD NEW OLD NEW")
5
Detectors Dual Channel Plate – Flat input surface – Very fast – Channels saturated by low mass ions Discrete Dynode Hybrid Exotic

7
ETP 500 ps Discrete dynode Magnetic multiplier

8
1 ns Typical single ion pulse with fast scintillator +/-30 kV+30 kV -1 kV 0 V Photonis detector Micro channel plate scintillator photomultiplier Signal out light e-e- Ion beam +20 kV 0 V Potential diagram for linear detector

9
VaVa VgVg 0 d0d0 d1d1 DsDs DvDv Sample Plate Extraction Electrode Space focus Detector Brown &Lennon 1992, Delayed extraction Wiley &Mclaren 1953, Time lag focusing With MALDI spatial distribution is small (crystals ca.10 m m) Velocity spread is large ca. 1m/s and independent of mass

10
3 10 30 60 Maximum Resolving Power for Linear Analyzer. Isotope limit Focus mass

11
Peptide mass spectrum for modern optimized linear analyzer with effective length of 1.6 m operating at 10 kV. M. L. Vestal and K. Hayden, Int. J. Mass Spectrometry 268, 83-92 (2007).
..")
12
Fig. 9 BSA (1 picomole/ l) in sinapinic acid matrix 10,000 laser shots in 2 s. M+M+ 2M + M 2+ M 3+ 3M + 3M 2+

13
M+M+ M 2+ M 3+ M2+M2+ M 3 2+ IgG

14
M+M+ M 2+ M 3+ M 4+ IgA

15
Linear MALDI-TOF Only mass spectrometer providing high sensitivity for singly charged high mass ions Resolving power 500-1000 over wide range is routine Normalization to TIC removes most of amplitude variation Each spot will yield up to 200,000 shots without degrading resolving power or accuracy and giving dynamic range limited only by chemical noise Results might be improved by multiple levels of dilution and use of alternative matrices Mass error <50 ppm across the plate over the full mass range with single peak automatic calibration Dynamic range up to100,000

16
Instruments for Clinical MALDI Linear MALDI-TOF preferred for most clinical applications – Simple, reliable, robust, and very sensitive over wide mass range – Reproducible spectra with wide dynamic range – Adequate mass resolving for higher mass proteins and oligos – Resolving power and mass accuracy may be insufficient for some applications to peptides and small molecules Reflector MALDI-TOF provides higher resolving power and mass accuracy – Allows identification by mass fingerprinting at low mass (e.g tryptic digests) – Provides accurate mass for input to MS-MS identification MALDI MS-MS
 – Provides accurate mass for input to MS-MS identification MALDI MS-MS")
17
Why is MALDI-TOF not Quantitative?

18
Lasers Nitrogen 337 nm, 10-50 Hz 50-500 shots/spectrum large spot size short life (10 million shots) Solid State, tripled YAG/YLF 349 or 355 nm 1-10 kHz 1000-1,000,000 shots/spectrum small spot size (20-100 m) long life (100 billion shots) Digitizers TDC (time-digital convertor) <1 ion/channel/shot Transient Digitizer (digital oscilloscope) OLD NEW OLD NEW
 Solid State, tripled YAG/YLF 349 or 355 nm 1-10 kHz ,000,000 shots/spectrum small spot size ( m) long life (100 billion shots) Digitizers TDC (time-digital convertor) <1 ion/channel/shot Transient Digitizer (digital oscilloscope) OLD NEW OLD NEW")
19
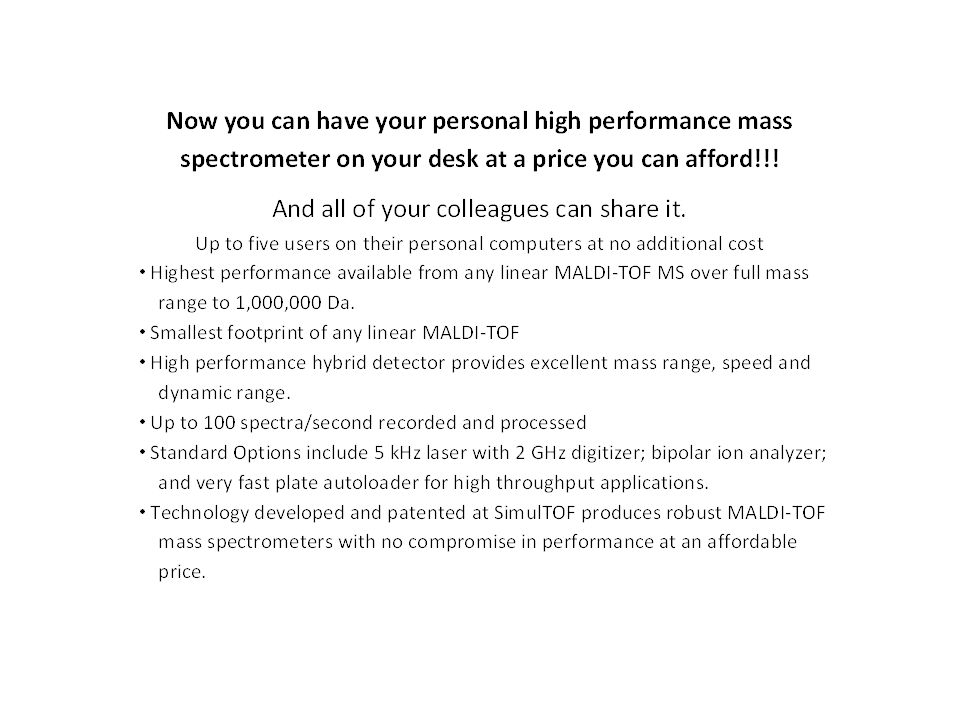
Introducing SimulTOF ONE MALDI-TOF Designed to make MALDI-TOF QUANTITATIVE!!! Visit booth 20 or Website: SimulTOF.com for details and demos

20
SimulTOF ONE MALDI-TOF for quantitative and clinical applications optimizes all of the elements employing state-of-the-art technology Lasers Digital electronics Ion detectors Ion optics Delayed extraction/time lag focusing Motion control DAC control of electronics Software, software, software

23
Features of SimulTOF ONE

24
0 -20 kV 105 Ion source channel plate 800 (1400) -4kV scintillator photomultiplier SimulTOF ONE Linear Analyzer MALDI Sample plate Extraction plate Acceleration plate Both sample plate and detector output at ground potential
 -4kV scintillator photomultiplier SimulTOF ONE Linear Analyzer MALDI Sample plate Extraction plate Acceleration plate Both sample plate and detector output at ground potential")
25
xy table first chamber (10 L void volume) Turbomolecular Vacuum pump Mechanical Vacuum pump B A Gauge Block diagram of SimulTOF ONE Sample Plate Second chamber (<1 mL void volume) TC gauge Vent valve
 Turbomolecular Vacuum pump Mechanical Vacuum pump B A Gauge Block diagram of SimulTOF ONE Sample Plate Second chamber (<1 mL void volume) TC gauge Vent valve")
26
27 85 96 spots Plus 4 cal spots 4 plates equal one 384 microtiter plate 2.6 mm dia spots One example of Sample plate for SimulTOF ONE Dimensions in mm barcode logo

27
Reproducibility of MALDI-TOF on well-behaved sample (saliva)
")
28
Figure 1. Comparison of saliva spectra with 50 laser shots averaged. Reproducibility of spectra acquired with small number of laser shots

29
Figure 2. Saliva spectrum with 11,900 laser shots averaged.

30
Figure 3. Comparison of Saliva spectrum from 4 spots with 11,000 laser shots averaged.

31
Figure 4. Comparison of 4 saliva spectra with 50 laser shots averaged vs. 4 with 11,000 laser shots over mass range 3 to 3.6 kDa

32
1.2 mm 50 m Microscopic image of MALDI matrix spot

33
Sinapinic acid Microscopic image of MALDI matrix spot

34
cyano-4-hydroxy cinnamic acid Microscopic image of MALDI matrix spot (ACCA)
")
35
200 m Microscopic image of MALDI matrix spot(ACCA) After laser raster at 200 m m spacing
 After laser raster at 200 m m spacing")
36
Image from on-board camera (E coli in ACCA)
")
37
Protein signal

38
Image from on-board camera (E coli in ACCA)
")
39
Protein signal

40
E coli mass spectrum (ACCA)
")
41
Spectra from 3 pixels on one spot

43
single spot human serum 1:10 dilution sinapinic acid matrix Laser 1.7 J, Extraction 2.7 kV, Delay 2050 ns, 1kHz Raster 25 m, 0.5 mm/s, 200 shots/sp

44
Image of single spot 25x100 m m pixels (241,600 laser shots)
")
45
Summed spectrum of single spot 25x100 m m pixels (241,600 laser shots)
")
47
1% Summed spectrum of single spot 25x100 m m pixels (241,600 laser shots)
")
49
1% Summed spectrum of single spot 25x100 m m pixels (241,600 laser shots)
")
51
1% Summed spectrum of single spot 25x100 m m pixels (241,600 laser shots)
")
52
Examples of quantitation by MALDI-TOF Hemoglobin A1C Whole blood diluted 1:2000 in sinapinic acid Analysis and quantitation of glycated hemoglobin by matrix assisted laser desorption ionization time of flight mass spectrometry, S. J. Hattan et al,. J Am Soc Mass Spectrom. 2016 Jan 5. [Epub ahead of print] PubMed PMID: 26733405.

53
Image of 2.6 mm spot (450,000 laser shots) with 25 m pixels, HCCA matrix 25 m raster @2 mm/s 7700 pixels @56 shots/pixel saved 5 kHz laser, 90 pixels/s, 90 s acquisition Blow-up of section of image Showing 25 m pixels Hemoglobin from whole blood 1:2000 dilution in HCCA matrix
 with 25 m pixels, HCCA matrix 25 m mm/s 7700 shots/pixel saved 5 kHz laser, 90 pixels/s, 90 s acquisition Blow-up of section of image Showing 25 m pixels Hemoglobin from whole blood 1:2000 dilution in HCCA matrix")
54
Single 25 m pixel Average Over full 2.6 mm spot 7700 pixels

55
Hemoglobin Sinapinic acid matrix + 1 + 2 + 3

56
Hemoglobin Sinapinic acid matrix glyco sinapinic acid

57
Overlay of all 80 spectra Glyco- GlyHb/Hb%CV % A13.521.39 B13.480.71 C13.200.62 D13.070.99 E13.070.96 F13.110.90 G12.980.67 H12.991.19 I13.050.96 J12.990.99 K13.080.92 L13.010.66 M13.161.00 N13.150.84 O13.220.70 P13.170.85 Average13.140.90 Std Dev0.16 Rel Std Dev1.22 +1 +2 +3 MALDI plate

Similar presentations


 is a soft ionization technique used in mass spectrometry, allowing.>")


 Today’s Lecture Mass Spectrometry.>")

 Reflectron TOF Fourier Transform.>")


 Ion Source Mass Analyzer Detector mass/charge intensity.>")